LAKE COUNTY, Calif. — Forecasters said an atmospheric river headed toward the North Coast is expected to bring high winds and heavy rainfall to Lake County this week, with the peak to hit on Wednesday.
The National Weather Service said the “impactful atmospheric river event” will bring moderate to heavy rainfall beginning late Tuesday night and continuing through Thursday, with more showers possible into Friday.
Over that time frame, the agency said rainfall totals will range from 2 to 4 inches with some localized totals of up to 7 inches possible over the south-facing terrain.
The specific Lake County forecast expects most of the rain to occur on Wednesday, with between four and five inches throughout the course of the day, with higher rainfall totals expected on the Northshore.
That heavy rainfall is forecast to cause a rapid rise in creeks, rivers and streams. Around the region, areas such as Eel River at Fernbridge, Navarro River at Navarro and Russian River at Hopland could exceed the flood stage by Thursday, the National Weather Service reported.
The rain in recent weeks has caused a significant rise in Clear Lake, which on Sunday night was at 5.33 feet Rumsey, the special measure for Clear Lake, up from 3.01 feet Rumsey on Jan. 1.
For comparison, Clear Lake’s level on Jan. 28 of the previous five years was as follows, based on United States Geological Survey gauge records:
Regarding temperature, conditions are expected to get colder, as more normal temperatures will return midweek, following the arrival of a cold front. Daytime temperatures will drop into the high 40s and nighttime temperatures will be in the low to mid 30s.
Email Elizabeth Larson at This email address is being protected from spambots. You need JavaScript enabled to view it.. Follow her on Twitter, @ERLarson, or Lake County News, @LakeCoNews.This email address is being protected from spambots. You need JavaScript enabled to view it.
KELSEYVILLE, Calif. — The Kelseyville Father-Daughter Dance Committee announced the upcoming 20th anniversary celebration, scheduled for Saturday, Feb. 17.
This highly anticipated event, open to participants of all ages, promises an enchanting evening dedicated to fostering and celebrating the cherished bonds between generations.
This year's dance will be adorned with the theme of love, friendship and hearts — Valentine's.
Attendees can expect a night filled with music, laughter, and memories as they revel in the joy of new and long standing connections.
The event proudly features dozens of prizes generously donated by local businesses, with Lake’s Limos and Tutti Frutti sponsoring a spectacular limo ride and frozen yogurt adventure for one lucky guest and eight of their friends.
The event will be held at Kelseyville Presbyterian Church, 5340 Third St.
On the evening of Feb. 17, there will be two dances. The first dance will take place from 5:30 to 7:30 p.m., with the second dance scheduled for 8 to 10 p.m.
Tickets cost $30 for one adult and one child. Additional tickets for children or adults available for purchase.
The ticket price includes a carnation flower for each child, a professional photo shoot with a souvenir photo, and a lavish box of sweet treats and refreshments.
Purchase your tickets early. Tickets can be purchased at Studebakers Coffee and Deli located in Kelseyville or online through their Facebook page, Kelseyville Father-Daughter Dance or through Eventbrite. Act fast, as tickets sell out every year.
Join them for an unforgettable night of love, laughter and community spirit at the 20th annual Lake County Father-Daughter Dance.
The Father-Daughter Dance team is dedicated to bringing joy to the community and 100% of the proceeds from this event contribute to post-high school scholarships for students in Lake County.
For inquiries or to make a donation, please contact Allison Panella at 707-483-2383.
NASA’s history-making Ingenuity Mars Helicopter has ended its mission at the Red Planet after surpassing expectations and making dozens more flights than planned.
While the helicopter remains upright and in communication with ground controllers, imagery of its Jan. 18 flight sent to Earth last week indicates one or more of its rotor blades sustained damage during landing, and it is no longer capable of flight.
Originally designed as a technology demonstration to perform up to five experimental test flights over 30 days, the first aircraft on another world operated from the Martian surface for almost three years, performed 72 flights, and flew more than 14 times farther than planned while logging more than two hours of total flight time.
“The historic journey of Ingenuity, the first aircraft on another planet, has come to end,” said NASA Administrator Bill Nelson. “That remarkable helicopter flew higher and farther than we ever imagined and helped NASA do what we do best – make the impossible, possible. Through missions like Ingenuity, NASA is paving the way for future flight in our solar system and smarter, safer human exploration to Mars and beyond.”
Ingenuity landed on Mars Feb. 18, 2021, attached to the belly of NASA’s Perseverance rover and first lifted off the Martian surface on April 19, proving that powered, controlled flight on Mars was possible.
After notching another four flights, it embarked on a new mission as an operations demonstration, serving as an aerial scout for Perseverance scientists and rover drivers. In 2023, the helicopter executed two successful flight tests that further expanded the team’s knowledge of its aerodynamic limits.
“At NASA JPL, innovation is at the heart of what we do,” said Leshin. “Ingenuity is an exemplar of the way we push the boundaries of what’s possible every day. I’m incredibly proud of our team behind this historic technological achievement and eager to see what they’ll invent next.”
Ingenuity’s team planned for the helicopter to make a short vertical flight on Jan. 18 to determine its location after executing an emergency landing on its previous flight.
Data shows that, as planned, the helicopter achieved a maximum altitude of 40 feet (12 meters) and hovered for 4.5 seconds before starting its descent at a velocity of 3.3 feet per second (1 meter per second).
However, about 3 feet (1 meter) above the surface, Ingenuity lost contact with the rover, which serves as a communications relay for the rotorcraft.
The following day, communications were reestablished and more information about the flight was relayed to ground controllers at NASA JPL. Imagery revealing damage to the rotor blade arrived several days later.
The cause of the communications dropout and the helicopter’s orientation at time of touchdown are still being investigated.
Triumphs, challenges
Over an extended mission that lasted for almost 1,000 Martian days, more than 33 times longer than originally planned, Ingenuity was upgraded with the ability to autonomously choose landing sites in treacherous terrain, dealt with a dead sensor, cleaned itself after dust storms, operated from 48 different airfields, performed three emergency landings, and survived a frigid Martian winter.
Designed to operate in spring, Ingenuity was unable to power its heaters throughout the night during the coldest parts of winter, resulting in the flight computer periodically freezing and resetting. These power “brownouts” required the team to redesign Ingenuity’s winter operations in order to keep flying.
With flight operations now concluded, the Ingenuity team will perform final tests on helicopter systems and download the remaining imagery and data in Ingenuity’s onboard memory. The Perseverance rover is currently too far away to attempt to image the helicopter at its final airfield.
“It’s humbling Ingenuity not only carries onboard a swatch from the original Wright Flyer, but also this helicopter followed in its footsteps and proved flight is possible on another world,” said Ingenuity’s project manager, Teddy Tzanetos of NASA JPL. “The Mars helicopter would have never flown once, much less 72 times, if it were not for the passion and dedication of the Ingenuity and Perseverance teams. History’s first Mars helicopter will leave behind an indelible mark on the future of space exploration and will inspire fleets of aircraft on Mars – and other worlds – for decades to come.”
The U.S. official poverty rate as measured by the American Community Survey (ACS), was 12.6% in 2022 but the rate was significantly different for the nation’s oldest and youngest populations, according to a Census Bureau report.
The ACS shows that in 2022 the child (people under age 18) poverty rate was 16.3%, 3.7 percentage points higher than the overall rate. But the poverty rate among those age 65 and over was 10.9%, 1.6 percentage points lower than the overall rate. The poverty rate for those ages 18 to 64 was 11.7%.
The following maps show the difference in state poverty rates for these three age groups. For comparison, they use the same poverty rate category values.
Although lower than the child poverty rate, the poverty rate of those 65 and older rose 0.7 percentage points while the child poverty rate decreased by 0.7 percentage points from 2021 to 2022 — the first time since 2018 the rates changed in opposite directions. Twice before (2009 and 2010), the reverse happened; that is, child poverty went up and poverty among those age 65 and over went down.
The poverty picture in four states – Arizona, Georgia, Maryland and New Jersey – was the same as the national one in 2022: the rate increased among those age 65-plus and decreased for children.
How poverty is measured
Poverty status is determined by comparing annual income to a set of dollar values (poverty thresholds) that vary by family size, number of children and the age of the householder.
If a family’s before-tax money income is less than the dollar value of their threshold, that family and every individual in it are in poverty. For people not living in families, poverty status is determined by comparing the individual’s income to their poverty threshold.
The poverty measure excludes children under age 15 who are not related to the householder, or people living in institutional group quarters or in college dormitories or military barracks.
Child poverty by state, region and metro area
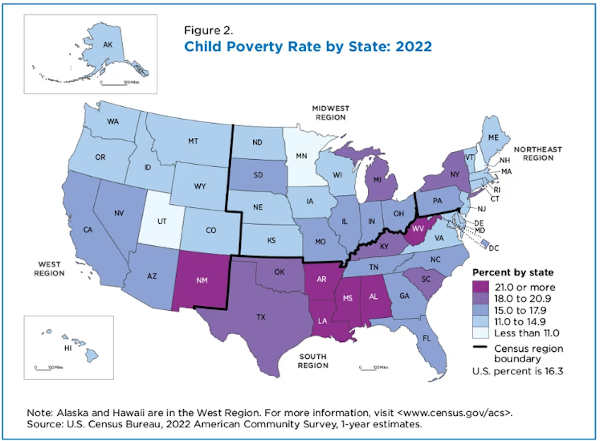
The national child poverty rate was 16.3% but there was considerable variation among states, ranging from 6.9% to 26.4%.
Figure 2 illustrates the uneven distribution of child poverty among states. This map, though similar to the Under 18 map in Figure 1, here just focuses on child poverty and how states compared to each other in 2022 at this age level.
In 2022, more than half (9) of the 17 states in the South region had child poverty rates of 18.0% or more, down from 12 Southern states and the District of Columbia in 2021.
The Midwest, Northeast and West each had only one state with child poverty rates of 18.0% or more.
More than three-quarters of states in the Northeast and nearly 70% in the West had poverty rates below 15.0%, corresponding to the two lowest map categories for child poverty.
Child poverty rates by state:
Among the lowest were in New Hampshire (6.9%) and Utah (8.4%). (These estimates are not significantly different from one another.)
Among the highest were in Mississippi (26.4%), West Virginia (25.0%) and Louisiana (24.6%). (These estimates are not significantly different from one another.) Eleven states and the District of Columbia had lower child poverty rates in 2022 than in 2021. Only one state, West Virginia, had a higher child poverty rate than in 2021.
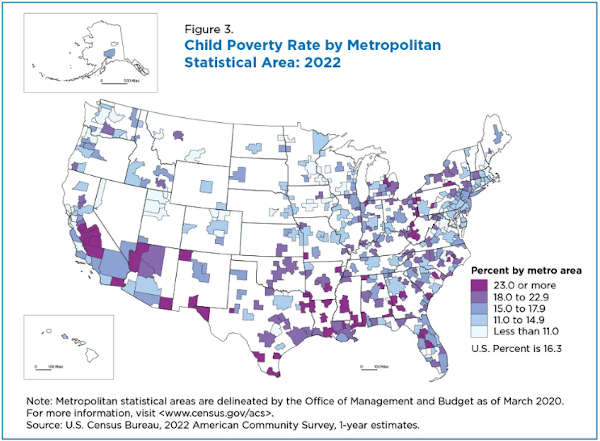
Child poverty rates also showed wide variations among the nation’s 384 Metropolitan Statistical Areas or metro areas in 2022, ranging from 3.7% to 40.9% (Figure 3); 25 metro areas saw child poverty rates rise and 35 rates fall from 2021 to 2022.
Nearly two -thirds of the metro areas with the nation’s highest child poverty rates were in the South and accounted for about a quarter of all the South’s metro areas.
High-poverty metro areas were disproportionately represented in the South. In contrast, nearly 40% of metro areas with the lowest poverty rates were in the West.
Poverty rate: Population 65 and over
In 2022, the national poverty rate of people age 65 and over was 10.9%, significantly lower than the national and the child poverty rates but up from 10.3% in 2021, marking the second year in a row that this group’s poverty rates increased.
There were geographic variations from 7.5% to 15.9% in these poverty rates but they were not as pronounced as for the child poverty rate (Figure 4).
Eight states in the South and the District of Columbia had poverty rates of 11.5% or more. No other region had more than three states with such high poverty rates among the 65-plus population.
State poverty rates for oldest age group:
Among the lowest: Utah (7.5%) Delaware (7.7%), Vermont (7.9%), New Hampshire (7.9%), and Colorado (8.0%). (These estimates are not significantly different from one another.)
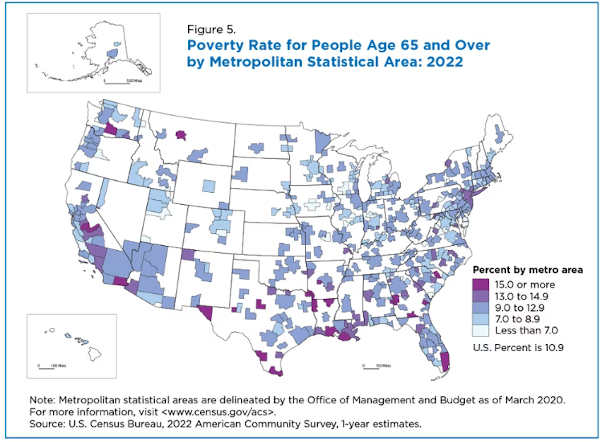
Among the highest were the District of Columbia (15.9%), Louisiana (14.8%) and Mississippi (14.7%). (These estimates are not significantly different from one another.) In metro areas, older population poverty rates ranged from 3.4% to 25.7% (Figure 5).
In 2022, most of the nation’s 63 metro areas with older population poverty rates of 13.0% or higher were in the South (42) or the West (14). More than a quarter of all the South’s metro areas fell into the two highest poverty categories compared to just 3.2% of those in the Midwest.
Poverty rates among those age 65-plus rose in 44 metro areas and fell in 11 metros from 2021 to 2022.
Additional poverty data from the 2022 release and links to poverty estimates from other surveys (such as the Current Population Survey Annual Social and Economic Supplement and the Survey of Income and Program Participation) are available on this topics page.
Craig Benson is a survey statistician in the Census Bureau’s Poverty Statistics Branch.
On Saturday, Gov. Gavin Newsom issued a proclamation declaring Jan. 26 through Feb. 2 as CalEITC Awareness Week.
The proclamation explains that the Earned Income Tax Credit, or EITC, “is one of the most effective tools we have to help lift working families and their children out of poverty. Beyond providing a critical immediate boost in family income to help meet basic needs, research shows that the EITC improves the health and educational outcomes of children in families who receive it.”
It continues, “Here in California, we have not only created our own California Earned Income Tax Credit (CalEITC) – which last year provided nearly 3.5 million California filers additional resources to make ends meet and provide for their families – but significantly bolstered the program by promoting more equitable access. California expanded the CalEITC, the Young Child Tax Credit, and the Foster Youth Tax Credit to include immigrant families who file with Individual Taxpayer Identification Numbers (ITIN), individuals who file taxes but are ineligible for most federal tax benefits.
“Our state is committed to reaching all the hardworking families eligible for these important supports to help set our kids – California's future – up for success. I encourage all Californians to check if they qualify for the California Earned Income Tax Credit, Young Child Tax Credit, or Foster Youth Tax Credit by visiting ftb.ca.gov/caleitc.”
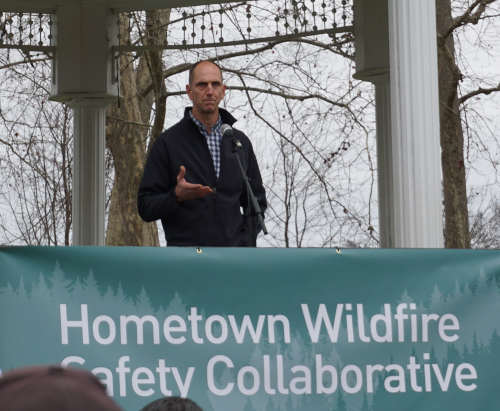
The Hogback Ridge fuels crew with their chipping machine at the Hometown Wildfire Safety Collaborative kickoff event in Lakeport, California, on Friday, Jan. 26, 2024. Photo by Elizabeth Larson/Lake County News. LAKEPORT, Calif. — Several Lake County fire agencies, nonprofits and Pacific Gas and Electric are joining together to take a new approach to keeping Lake County fire safe and resilient.
The Hometown Wildfire Safety Collaborative is a partnership whose members include Pacific Gas and Electric, the Clear Lake Environmental Research Center, Northshore Fire Protection District, Lake County Fire Chiefs Association, California Fire Chiefs Association, Gordon and Betty Moore Foundation, US Forest Service and Cal Fire.
An event to celebrate the collaboration’s launch was held outside, at the Library Park gazebo, during an unseasonably warm Friday afternoon to announce the launch of the Hometown Wildfire Safety Collaborative .
PG&E said the collaboration will provide financial support for local fuel reduction projects; an updated community wildfire protection plan specific to Lake County, which utilizes computer modeling to predict wildfire pathways to inform community discussions on the most effective and strategic locations for fuel reduction projects; and an environmentally friendly biomass usage program.
Will Evans, president of the Clear Lake Environmental Research Center, or CLERC, said his organization focuses on economic and environmental problems facing Lake County, with wildfire being one of the biggest.
An example: The Konocti interface in and around the Kelseyville Riviera, which was the focus of a Cal Fire fuel break project in 2017, is one of the most dangerous places in California for evacuations, Evans said.
Evans said they faced three key questions: How to stabilize funding for their work; how to prioritize projects; and what to do with the massive amount of wood from dead and dying trees across Lake County, the result not just of wildfires but of disease and insects.
Chief Dave Winnacker of the California Fire Chiefs Association speaks at the Hometown Wildfire Safety Collaborative kickoff event in Lakeport, California, on Friday, Jan. 26, 2024. Photo by Elizabeth Larson/Lake County News. He said the best minds in California have been thinking about these questions, and the collaboration is meant to further that work.
At the collaboration’s heart is the fuel reduction partnership between CLERC and the Northshore Fire Protection District, which created the Hogback Ridge fuels crew.
In the fall, PG&E launched the collaboration with a $500,000 grant to CLERC, which Evans said will allow them to increase the crew’s wages and stabilize their wages.
Evans said CLERC also is developing a dynamic fire pathways model that will protect people and interrupt the progression of damaging fires.
When it comes to what to do with all of that wood, Evans said they are conducting a pilot project with a mobile biochar manufacturing machine.
Last year, CLERC received a grant to replant 1,065 acres of forest land. That will require removing the dead trees already there, which Evans said has been estimated to be 75,000 tons of biomass.
He said that led to the question of what it will take to get a biochar facility going.
Northshore Fire Protection District Chief Mike Ciancio speaks during the Hometown Wildfire Safety Collaborative in Lakeport, California, on Friday, Jan. 26, 2024. Photo by Elizabeth Larson/Lake County News. The U.S. Department of Agriculture defines biochar as a “stable solid, rich in carbon that is made from organic waste material or biomass that is partially combusted in the presence of limited oxygen.”
Evans said they are looking at rolling out the project in the Mendocino National Forest and in the Cobb and Middletown areas over the coming 12 months.
Chief Dave Winnacker of the Moraga Orinda Fire Protection District, a board member of the California Fire Chiefs Association, said wildfire is a pressing problem.
While most of the focus has been on the focus of fire and its destruction, not as much attention has been placed on the fact that California is a fire dependent landscape. Winnacker emphasized the necessity of all residents to work together to be a “fire adapted” community.
He said there also has been a lot of effort to address fire itself, but fewer efforts to reduce loss and nonrenewals in the fire insurance space.
Smokey Bear visits with community members at the kickoff event for the Hometown Wildfire Safety Collaborative in Lakeport, California, on Friday, Jan. 26, 2024. Photo by Elizabeth Larson/Lake County News. Lake County can be an example of success at adapting and thriving in the fire landscape, with Winnacker suggesting that the collaboration can set conditions for longer term goals of improving the health of landscapes that depend on fire.
Genny Biggs of the Gordon and Betty Moore Foundation focuses on special projects that include wildfire. She said too many communities are vulnerable to extreme wildfire.
She spoke of the work with PG&E to protect communities and disrupt fire pathways, and effort that requires innovation. Based on the collaboration, Biggs said Lake County will be a strong example across the western United States.
Northshore Fire Chief Mike Ciancio thanked the agency partners, his own staff and board, and CLERC for their support and faith in his vision for forming the Hogback Ridge fuels crew, which he started “from zero.”
He said he believes reputation shows through work, and the crew is working very hard every day.
“It’s a village, right? We’re a village here,” said Ciancio, explaining it will take collaboration to make the plan work and have a more resilient community.
He described how he went to the Habematolel Pomo tribe first to explain his vision for the fuels crew, and the tribe ran with it and funded it — including the crew’s wages — for the first year.
The Hogback Ridge fuels crew’s chipping equipment, on display at the Hometown Wildfire Safety Collaborative kickoff event in Lakeport, California, on Friday, Jan. 26, 2024. Photo by Elizabeth Larson/Lake County News. Then the Board of Supervisors heard his presentation and the county of Lake purchased the equipment.
The crew is keeping busy year-round with fuel reduction projects. PG&E said that, since September, the crew has completed several local wildfire safety projects that include creating defensible space between dwellings and vegetation.
They’ve also focused on vegetation management work around some of Lake County’s elderly and assisted living facilities that may not have the resources to execute the wildfire safety work themselves.
Team members told Lake County News they’re now working on a project along Elk Mountain Road near Upper Lake.
Ciancio said they’re also trained to fight fires, and have worked on a dozen so far. That allows his department to release resources back to their stations during incidents.
He said PG&E’s financial support through the collaboration is allowing them to increase wages and to add more members. Five new crew members will be hired, bringing the total crew size to 16.
The crew also will work on community wildfire protection plan projects, and Ciancio said his agency will work with CLERC to determine priorities.
Tom Nixon, a retired State Parks ranger and CLERC board member, said of the collaboration, “It’s all about building partnerships.”
Email Elizabeth Larson at This email address is being protected from spambots. You need JavaScript enabled to view it.. Follow her on Twitter, @ERLarson, or Lake County News, @LakeCoNews.
Many people are wired to seek and respond to rewards. Your brain interprets food as rewarding when you are hungry and water as rewarding when you are thirsty. But addictive substances like alcohol and drugs of abuse can overwhelm the natural reward pathways in your brain, resulting in intolerable cravings and reduced impulse control.
A popular misconception is that addiction is a result of low willpower. But an explosion of knowledge and technology in the field of molecular genetics has changed our basic understanding of addiction drastically over the past decade. The general consensus among scientists and health care professionals is that there is a strong neurobiological and genetic basis for addiction.
As a behavioral neurogeneticistleading a team investigating the molecular mechanisms of addiction, I combine neuroscience with genetics to understand how alcohol and drugs influence the brain. In the past decade, I have seen changes in our understanding of the molecular mechanisms of addiction, largely due to a better understanding of how genes are dynamically regulated in the brain. New ways of thinking about how addictions form have the potential to change how we approach treatment.
Alcohol and drugs affect brain gene activity
Each of your brain cells has your genetic code stored in long strands of DNA. For all that DNA to fit into a cell, it needs to be packed tightly. This is achieved by winding the DNA around “spools” of protein called histones. Areas where DNA is unwound contain active genes coding for proteins that serve important functions within the cell.
When gene activity changes, the proteins your cells produce also change. Such changes can range from a single neuronal connection in your brain to how you behave. This genetic choreography suggests that while your genes affect how your brain develops, which genes are turned on or off when you are learning new things is dynamic and adapts to suit your daily needs.
Recent data from animal models suggests that alcohol and drugs of abuse directly influence changes in gene expression in areas of the brain that help drive memory and reward responses.
Within each neuron in the brain, how tightly DNA is wound around or bound to histones and other proteins determines which genes are expressed and which proteins are produced.Karla Kaun and Vinald Francis, CC BY-ND
There are many ways addictive substances can change gene expression. They can alter which proteins bind to DNA to turn genes on and off and which segments of DNA are unwound. They can change the process of how DNA is read and translated into proteins, as well as alter the proteins that determine how cells use energy to function.
For example, alcohol can cause an alternative form of a gene to be expressed in the memory circuits in fliesand people, resulting in changes in dopamine receptors and transcription factors involved in reward signaling and neuronal function. Similarly, cocaine can cause an alternative form of a gene to be expressed in the reward centersof mice, leading them to seek out more cocaine.
Exactly how these drugs cause changes in gene regulation is unknown. However, a direct link between alcohol consumption and changes in gene expression in mice provides a clue. A byproduct of alcohol being broken down in the liver called acetate can cross the blood-brain barrier and unwind DNA from histones in mouse memory circuits.
Alcohol, nicotine, cocaine and opioids also all activate important signaling pathways that are central regulators of metabolism. This suggests they can also affect many aspects of neuronal function and consequently affect which genes are expressed.
Changing brain gene activity with lifestyle
How addictive substances change cell function is complex. The version of a gene you’re born with can be modified in many ways before it becomes a functional protein, including exposure to alcohol and drugs. Rather than discouraging researchers, this complexity is empowering because it provides evidence that changes to gene expression in your brain aren’t permanent. They can also be altered by medications and lifestyle choices.
Many commonly prescribed medications for mental health disorders also affect gene expression. Antidepressants andmood stabilizers can change how DNA is modified and which genes are expressed. For example, a commonly prescribed drug for depression called escitalopram affects how tightly wound DNA is and can change the expression of genes important to brain plasticity.
Additionally, mRNA-based therapies can specifically change which genes are expressed to treat diseases like cancer. In the future, we may discover similar therapies for alcohol and substance use disorder. These treatments could potentially target important signaling pathways linked to addiction, altering how brain circuits function and how alcohol and drugs affect them.
Lifestyle choices can also affect gene expression in your brain, though researchers don’t yet know whether they can alter the changes induced by addictive substances.
Like alcohol and drugs, dietary changes can affect gene expression in many ways. In flies, a high sugar diet can reprogram the ability to taste sweetness by tapping into a gene expression network involved in development.
Work in animal models has also shown that exercise changes gene expression by altering both histonesand themolecular tags directly attached to DNA. This increases the activity of genes important to the activity and plasticity of neurons, supporting the idea that exercise improves learning and memory and can decrease the risk of dementia.
From Dry January and beyond, many factors can have profound effects on your brain biology. Taking steps to reduce consumption of alcohol and drugs and picking up healthy lifestyle practices can help stabilize and bring long-lasting benefits for your physical and mental health.
A sense of calling can provide workers a feeling of higher purpose in their jobs. megaflopp/Getty Images
Many Americans – especially young adults – want to do work that feels meaningful. Creating meaning for oneself may be especially important as fewer workplaces provide good pay and benefits to their employees.
Those who are religious or spiritual often want to connect their faith to their work through a sense of calling. But there can be unexpected downsides for those who do so. People who say they feel “called” report better work and life satisfaction, but they may also be less likely to address workplace problems or unfair treatment when it arises.
Faith in workplaces
As scholarswho studyreligion in the workplace, we have found that about 1 in 5 American workers agree with the statement, “I see my work as a spiritual calling.” Most of those who see their work in this way link it to religious sensibilities and practices.
Even though faith can be deeply connected to work, there are few comprehensive studies on this topic. In 2018 and again in 2021, we gathered responses from across the United States on how people see their faith in relation to their work.
Over 15,000 people representing a cross section of American adults filled out our surveys. These respondents included individuals from many different faith traditions and also those who did not follow a religious tradition. We also conducted in-depth interviews with over 250 of our survey-takers.
We found that 53% of Americans who feel called to their work are “very satisfied” with their current job compared with 39% of those who do not feel called.
Religious calling in work
The “concept of calling” has roots in Christian history, where people felt called to serve the church. More recently, calling has been extended to a possibility for any person in any job that serves the world.
There is no widely agreed-upon definition of what a modern-day spiritual calling might entail. Business scholars Mitchell Neubert and Katie Halbeslebendefine it as “a summons from God to approach work with a sense of purpose and a pursuit of excellence in work practices.”
Findings that relate calling to positive workplace outcomes are consistent with previous research that shows viewing work as a calling has a positive effect on worker satisfaction, mental health and well-being, including feeling one’s talents are being well used. As one respondent whom we interviewed told us, “I definitely feel more fulfilled in my work because of my faith, and vice versa. I feel like I’m being a better Christian by doing the work that I do …”
Yet, less is known about the specifics of how people see their work as a calling. Interviews we conducted found that a sense of calling provides workers with higher purpose in their work, especially when facing work that is either extremely challenging or mundane.
For example, teachers talked about dealing with the bureaucracy of state educational systems, and medical service workers discussed the daily grind of mopping floors and handling bodily waste. However, despite the challenges of their work, these people also acknowledged that they were able to get through the day-to-day aspects of their jobs because they felt spiritually called to their work.
Being called to work has downsides
There is reason to be cautious, however, in touting the advantages of viewing work as a calling without also considering the detrimental effects that can emerge.
For example, people who feel that God intended them to be in their current workplace or industry might be more disposed to stay in their current role regardless of unfair treatment or working conditions that take advantage of them, such as being underpaid or overworked. Specifically, in previous work we found that people who do feel called to their work report higher job satisfaction – even when they are experiencing discrimination – than people who do not feel called to their work.
A sense of calling may make people less likely to initiate changes to problematic workplace situations. Indeed, as we found in our research, those who view their work as a calling but also perceive discrimination in the workplace report being less likely to speak up in these situations compared with those who do not attach the same meaning to their work.
This can be especially detrimental for those of racial and religious minority groups who are more likely to experience discrimination at work in the first place. As one woman who works in government told us, “It is difficult being an African American woman in my field, so my faith allows me to step back sometimes and remove myself from the situation.”
This also shows how religion may help individuals cope with discrimination at work, but sometimes in a way that could detract from actively seeking change.
The double-edged sword
Experiencing work as a calling can be a double-edged sword. Because those who feel called to their work have a high level of commitment to their jobs, they tend to be more likely to tolerate, endure or ignore work situations that are unreasonable, inequitable or even discriminatory.
Surveys have found that workers who believe in calling are more likely to tolerate exploitative situations.shironosov/Getty Images
According to organizational ethics scholars Stuart Bunderson and Jeffery Thompson, workers who feel called to their jobs are “more likely to see their work as a moral duty, and to sacrifice pay, personal time and comfort for their work.” Thus, it can become easier for organizations to exploit these employees, whether they do so intentionally or unintentionally.
Having and being led by a sense of calling is also linked to financial stability. According to our data, 68% of people who do not feel called to their work agree that “the primary reason” they do the work is to make money. In comparison, 47% of those who experience a sense of calling view making money as their primary reason for working.
The discrepancy could also speak to gender, race and class privileges. In her research on the “passion principle” – the idea that Americans feel the need to follow their passion and choose jobs they find fascinating, intriguing or fulfilling – sociologist Erin Cech notes how the concept of pursuing paid work that one loves or feels called to can inadvertently foster structural and cultural inequalities. According to Cech, race and class can influence the freedom to choose their work. Not surprisingly, Cech found that white, upper-class men who did not need to worry about money as much enjoyed the most liberty to do so.
Our research also shows that when workers see their job as a spiritual calling, it can blind them to the difficulties others experience at work. They may be less able to empathize with those who feel stuck in their job because of money concerns, are unhappy or unfulfilled in their work, or are struggling to find a job.
Our surveys reveal that 60% of those who view their work as a calling agree that “anyone can find a good job if they try hard enough,” whereas only 49% of those who do not view their work as a calling concur.
Based on these findings, we suggest that leaders in organizations can help cultivate a sense of calling in workers by helping them identify their particular gifts and interests and facilitate their development along these pathways. At the same time, they can and should encourage feedback that can lead to a healthier workplace for everyone.
The council chambers will be open to the public for the meeting. Masks are highly encouraged where 6-foot distancing cannot be maintained.
If you cannot attend in person, and would like to speak on an agenda item, you can access the Zoom meeting remotely at this link or join by phone by calling toll-free 669-900-9128 or 346-248-7799.
The webinar ID is 973 6820 1787, access code is 477973; the audio pin will be shown after joining the webinar. Those phoning in without using the web link will be in “listen mode” only and will not be able to participate or comment.
Comments can be submitted by email to This email address is being protected from spambots. You need JavaScript enabled to view it.. To give the city clerk adequate time to print out comments for consideration at the meeting, please submit written comments before 3:30 p.m. on Monday, Jan. 29.
On the agenda is the approval of a supplemental agreement and contract change order with Square Signs LLC dba Front Signs for the HSIP Sign Repair and Replacement Project. The new contract amount is $46,514.
The council also will approve the plans, specifications and working details and award a construction contract to Wylatti Resource Management Inc. for the GSL Pavement Rehabilitation Project and authorize the City Manager to execute the construction contract for the bid amount of $444,113.35.
Email Elizabeth Larson at This email address is being protected from spambots. You need JavaScript enabled to view it.. Follow her on Twitter, @ERLarson, or Lake County News, @LakeCoNews.
A world map plotted with color blocks depicting percentiles of global average land and ocean temperatures for the full year 2023. Color blocks depict increasing warmth, from dark blue (record-coldest area) to dark red (record-warmest area) and spanning areas in between that were "much cooler than average" through "much warmer than average." Image credit: NOAA NCEI. It’s official: 2023 was the planet’s warmest year on record, according to an analysis by scientists from NOAA’s National Centers for Environmental Information, or NCEI.
Along with the historic heat, Antarctic sea ice coverage dropped to a record low in 2023.
“After seeing the 2023 climate analysis, I have to pause and say that the findings are astounding,” said NOAA Chief Scientist Dr. Sarah Kapnick. “Not only was 2023 the warmest year in NOAA’s 174-year climate record — it was the warmest by far. A warming planet means we need to be prepared for the impacts of climate change that are happening here and now, like extreme weather events that become both more frequent and severe.
"We will continue to see records broken and extreme events grow until emissions go to zero,” Kapnick said. “Government policy can address both emissions, but also actions to reduce climate impacts by building resilience."
Earth’s average land and ocean surface temperature in 2023 was 2.12 degrees F (1.18 degrees C) above the 20th century — the highest global temperature among all years in NOAA’s 1850-2023 climate record. It also beats the next warmest year, 2016, by a record-setting margin of 0.27 of a degree F (0.15 of a degree C).
The 10 warmest years since 1850 have all occurred in the past decade. In fact, the average global temperature for 2023 exceeded the pre-industrial (1850–1900) average by 2.43 degrees F (1.35 degrees C).
Looking ahead, there is a one-in-three chance that 2024 will be warmer than 2023, and a 99% chance that 2024 will rank among the top five warmest years.
2023 as ranked by other scientific organizations
Other scientific organizations, including NASA, the Copernicus Climate Change Service and the UK Met Office have conducted separate but similar analyses that also rank 2023 as the warmest year on record.
Other notable climate findings and events
• Global ocean heat content set a new record high: The 2023 upper ocean heat content, which addresses the amount of heat stored in the upper 2,000 meters of the ocean, was the highest on record. Ocean heat content is a key climate indicator because the ocean stores 90% of the excess heat in the Earth system. The indicator has been tracked globally since 1958, and there has been a steady upward trend since approximately 1970. The five highest values have all occurred in the last five years. • Polar sea ice was scant: The 2023 annual Antarctic sea ice extent (coverage) averaged 3.79 million square miles in 2023, the lowest on record. The maximum extent in September was 6.55 million square miles, which was the lowest by a record margin. The minimum extent in February was 690,000 square miles, which set a record low for the second consecutive year. Arctic sea ice coverage averaged 4.05 million square miles in 2023, ranking among the 10 lowest years on record. The maximum extent in March was 5.64 million square miles, which ranked fifth lowest, while the minimum extent in September was 1.63 million square miles, which ranked sixth lowest. • December 2023 set records: Global surface temperature in December 2023 was 2.57 degrees F (1.43 degrees C) above the 20th-century average — the warmest December on record. For the ninth consecutive month, the global ocean surface temperature was also record warm. Looking regionally, North America and South America both had their warmest December on record.
An annotated map of the world plotted with the year's most significant climate events. Please see the story below as well as the report summary from NOAA NCEI at http://bit.ly/Global202312. Image credit: NOAA NCEI.
LAKE COUNTY, Calif. — Lake County Animal Care and Control has a full house of dogs of every size and breed waiting for their new homes.
Dogs available for adoption this week include mixes of Alaskan husky, Australian cattle dog, Australian shepherd, border collie, boxer, bulldog, chihuahua, Doberman pinscher, German shepherd, hound, Labrador retriever, pit bull, Queensland heeler, Rottweiler, shepherd and terrier.
Dogs that are adopted from Lake County Animal Care and Control are either neutered or spayed, microchipped and, if old enough, given a rabies shot and county license before being released to their new owner. License fees do not apply to residents of the cities of Lakeport or Clearlake.
Those dogs and the others shown on this page at the Lake County Animal Care and Control shelter have been cleared for adoption.
Call Lake County Animal Care and Control at 707-263-0278 or visit the shelter online for information on visiting or adopting.
The shelter is located at 4949 Helbush in Lakeport.
Email Elizabeth Larson at This email address is being protected from spambots. You need JavaScript enabled to view it.. Follow her on Twitter, @ERLarson, or Lake County News, @LakeCoNews.
WillowsFoster(Yukon)
Kennel#31
Kennel#8
Kennel#7(Lexi)
SadieFoster
Kennel#5(Benji)
Kennel#3(Holly)
Kennel#10
Kennel#22
Kennel#9
Kennel#12
Kennel#13(Rex)
Kennel#29
Kennel#16(Mocha)
Kennel#4
Kennel#23
Kennel#11a
Kennel#11b
Kennel#17a
Kennel#17b
Kennel#26a
Kennel#26b
Kennel#14a
Kennel#14b
Kennel#30a
Kennel#30b
Kennel#30c
Kennel#33
CatroomA#63
CatroomA#66
CatroomA#20
Kennel#28(Rambo)
Kennel#24(Bubbles)
Kennel#25
Kennel#6
Kennel#21
Kennel#32(Luna)
Kennel#19a
Kennel#19b
Kennel#19c
Kennel#20a
Kennel#20b
Kennel#20c
Kennel#18
Scott Jasechko, University of California, Santa Barbara; Debra Perrone, University of California, Santa Barbara, and Richard Taylor, UCL
Circular irrigation for growing hay and alfalfa near Corcoran, Calif. − a water-intensive system that relies on groundwater pumping. George Rose/Getty Images
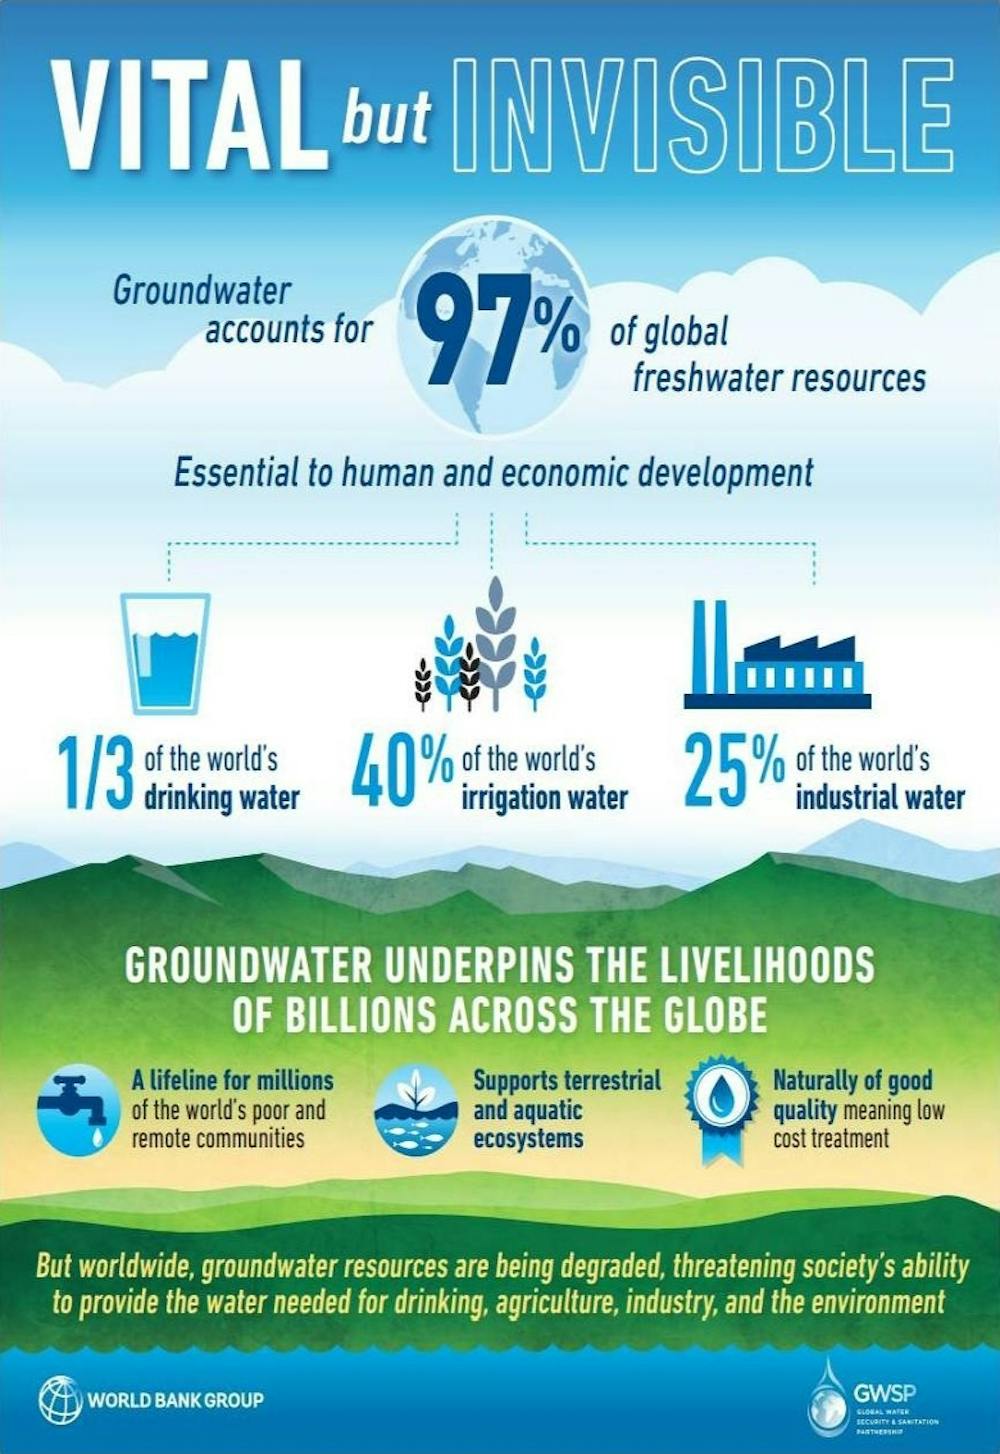
If you stand at practically any point on Earth, there is water moving through the ground beneath your feet. Groundwater provides about half of the world’s population with drinking water and nearly half of all water used to irrigate crops. It sustains rivers, lakes and wetlands during droughts.
Groundwater is a renewable resource, but it can take decades or even centuries for some aquifers to recover after they are depleted. Current understanding of this challenge is based mainly on where and how frequently people record measurements of water levels in wells.
In a newly published study, our team of data scientists, water specialists and policy experts compiled the first global-scale dataset of these levels. We analyzed millions of groundwater level measurements in 170,000 wells located in over 40 countries and mapped how groundwater levels have changed over time.
Our study has two main findings. First, we show that rapid groundwater depletion is widespread around the world and that rates of decline have accelerated in recent decades, with levels falling by 20 inches or more yearly in some locations. Second, however, our research also reveals many cases where deliberate actions halted groundwater depletion. These results show that societies are not inevitably doomed to drain their groundwater supplies, and that with timely interventions, this important resource can recover.
Communities in Bangkok, Tucson and Albuquerque have found ways to replenish their groundwater sources.
Portrait of a thirsty planet
Many factors determine groundwater levels, including geology, climate and land use. But groundwater levels that are dropping deeper and deeper in a particular location often signal that people are pumping it out faster than nature can replenish it.
Some of the 300 million measurements we compiled were recorded by automated measuring devices. Many others were made in the field by people around the globe. And these measurements paint a worrying picture.
They show that groundwater levels have declined since the year 2000 in far more places than they rose. In many locations, especially arid zones that are heavily farmed and irrigated, groundwater levels are falling by more than 20 inches (0.5 meters) per year. Examples include Afghanistan, Chile, China, Peninsular India, Iran, Mexico, Morocco, Saudi Arabia, Spain and the U.S. Southwest.
Our second and more concerning finding is that in about one-third of the areas where we compiled measurements, the rate of groundwater decline is accelerating. Accelerated groundwater decline is common in dry climates where large swaths of land are used for agriculture. This suggests a potential link between groundwater-fed irrigation and intensifying groundwater depletion.
Groundwater is an essential but underappreciated resource worldwide.World Bank, CC BY-ND
What happens when groundwater is overused?
Rapid and accelerating groundwater-level declines have many harmful effects.
Drinking-water supplies from wells and springs can run dry when groundwater levels decline. People and communities who rely on those wells can lose access to what may be their sole source of accessible fresh water for drinking.
Farther from the coast, land subsidence can damage infrastructure. It poses a critical challenge in areas where groundwater levels have declined, including Tehran and Mexico City. In many cases, the main culprit is excessive groundwater pumping.
Finally, falling groundwater can cause seawater to move inland underground and contaminate coastal groundwater systems – a process known as seawater intrusion. When seawater intrudes, coastal aquifers can become too saline to use for drinking water without energy-intensive desalination.
How to replenish groundwater supplies
We also found places where groundwater levels are recovering. The strategies that communities used to replenish their groundwater sources included developing new alternative water supplies, such as local rivers; adopting policies to reduce demand for groundwater; and intentionally replenishing aquifers with surface water.
The town of El Dorado, Arkansas, saw its groundwater levels drop by roughly 200 feet (60 meters) from 1940 through 2000 as local industries pumped water from the aquifer. In 1999, a new policy established a pumping fee structure, giving businesses an incentive to find a new water supply. By 2005, a pipeline had been built to divert water from the Ouachita River to El Dorado. This new source reduced demand for groundwater, and groundwater levels have risen in the area since 2005.
In wet years, water managers in Fresno, Calif., pump water out of rivers and canals into recharge basins. There, the water can sink slowly into the ground and recharge groundwater supplies.
In a valley near Tucson, Arizona, groundwater levels declined by 100 feet (30 meters) as withdrawals for irrigation increased after the 1940s. To help replenish the depleted groundwater, leaky ponds were constructed. These ponds are filled with water from the Colorado River that is moved hundreds of miles to the area via canals. As these ponds leak, they refill the depleted aquifer. Because of these leaky ponds, groundwater levels in the valley have risen by about 200 feet (60 meters) in places.
Our analysis shows how important it is to monitor groundwater levels in many locations. With groundwater levels declining in many places, communities and businesses that depend on it need accurate information about their water supplies so they can act in time to protect them.

 How to resolve AdBlock issue?