LAKE COUNTY, Calif. — Lake County Public Health is raising awareness regarding the concerning increase in rates of Hepatitis C within the community.
Hepatitis C is a liver disease caused by the hepatitis C virus, or HCV, primarily transmitted through exposure to infected blood.
This increase highlights the importance of education, prevention, and access to testing and treatment services.
Hepatitis C can be transmitted through various means, including sharing needles, syringes, or other drug paraphernalia, needle-stick injuries in health care settings, or through birth from an infected mother.
Less commonly, transmission can occur through sharing personal care items that may have come into contact with infected blood or through unprotected sexual contact, particularly in individuals with HIV or other sexually transmitted diseases.
Hepatitis C is a serious health concern that requires immediate attention. It can range from acute to chronic infection, potentially leading to long-term health complications if left untreated.
Therefore, it is crucial for individuals to be aware of the risks, get tested, and seek appropriate care.
Testing for Hepatitis C is recommended for individuals who may have been exposed to the virus, especially those with a history of injection drug use, healthcare workers at risk of needle-stick injuries, or individuals born to mothers with Hepatitis C.
Early detection allows for timely intervention and treatment, which can significantly improve health outcomes.
If you test positive for Hepatitis C, it's important to contact your doctor promptly. Additional testing may be necessary to confirm the diagnosis and assess the extent of liver damage.
Fortunately, Hepatitis C can now be cured for most people in as little as 8 to 12 weeks with minimal side effects.
National guidelines recommend treatment for nearly everyone diagnosed with Hepatitis C, regardless of drug use or recovery status.
Treatment not only cures the infection but also reduces the risk of transmission to others.
Lake County Public Health encourages community members to prioritize their health by seeking testing and, if necessary, treatment for Hepatitis C.
Furthermore, individuals are urged to adopt preventive measures, such as practicing safe injection practices, using barrier methods during sexual activity, and avoiding sharing personal care items that may carry bloodborne pathogens.
For more information on Hepatitis C testing, treatment, and prevention resources, please contact Lake County Public Health at 707-263-1090.
LAKE COUNTY, Calif. — The sunny and warm weather Lake County has been enjoying for the past week is about to give way to more rain this week.
The National Weather Service is predicting the dry and “unseasonably mild weather” will continue during the first half of the week.
Rain is then forecast to arrive on Friday and continue with chances of showers into Monday.
Temperatures will drop to the high 40s during the day and into the high 30s at night during that time, according to the forecast.
Throughout the North Coast region, there also will be chances of snow in the higher elevations, beginning at between 5,000 and 6,000 feet on Thursday and dropping to the range of 3,500 to 4,500 feet.
Email Elizabeth Larson at This email address is being protected from spambots. You need JavaScript enabled to view it.. Follow her on Twitter, @ERLarson, or Lake County News, @LakeCoNews.
The council chambers will be open to the public for the meeting. Masks are highly encouraged where 6-foot distancing cannot be maintained.
If you cannot attend in person, and would like to speak on an agenda item, you can access the Zoom meeting remotely at this link or join by phone by calling toll-free 669-900-9128 or 346-248-7799.
The webinar ID is 973 6820 1787, access code is 477973; the audio pin will be shown after joining the webinar. Those phoning in without using the web link will be in “listen mode” only and will not be able to participate or comment.
Comments can be submitted by email to This email address is being protected from spambots. You need JavaScript enabled to view it.. To give the city clerk adequate time to print out comments for consideration at the meeting, please submit written comments before 3:30 p.m. on Tuesday, March 19.
On Tuesday, the council will start off the evening with the introduction of new employees Bryan Carlson, Mel Olea, Jen Baker and Michelle Brown.
The council will hold a public hearing ahead of its consideration of adopting a 2% permit fee for permit processing, inspections, public awareness and education campaigns, and fire operations and suppression efforts related to the sale of safe and sane fireworks.
City documents indicate the city already has a 5% permit fee on the fireworks.
The city of Lakeport is the only place in Lake County where fireworks are permitted. That’s because voters passed Measure C in November 2009 after the council had attempted to end fireworks sales.
In council business, staff will ask council members to adopt a proposed resolution authorizing the submittal of an application to the California State Department of Housing and Community Development for funding under the HOME Investment Partnership Program.
City Manager Kevin Ingram also will present a progress update on staff’s work to meet the 2023-24 departmental goals.
On the consent agenda — items considered noncontroversial and usually accepted as a slate on one vote — are ordinances; minutes of the City Council’s regular meetings on March 5; receipt and filing of the 2023 Housing Element Annual Progress Report; and receipt and filing of the 2023 2nd Quarter Community Development Report.
Email Elizabeth Larson at This email address is being protected from spambots. You need JavaScript enabled to view it.. Follow her on Twitter, @ERLarson, or Lake County News, @LakeCoNews.
A new report gives a picture of the state’s resources as it faces a budget shortfall.
State Controller Malia M. Cohen has issued the state’s Annual Comprehensive Financial Report, or ACFR, for the fiscal year that ended June 30, 2022, showing General Fund revenues of $199.2 billion, a $2.2 billion or 1.1 percent increase compared to the prior year.
General Fund revenues from personal income taxes were $123.3 billion, a $6.2 billion or 4.8 percent decrease from prior fiscal year revenues.
General Fund revenues from sales and use taxes of $32.8 billion increased by nearly $3.7 billion, or 12.6 percent from the prior year, primarily due to the rebound of retail sales activities in the aftermath of the COVID-19 pandemic.
Corporation taxes were $35.8 billion and increased by nearly $3.7 billion, or 11.5 percent from the prior year, due to a continued growth in retail sales and investments consistent with the prior year’s upsurge.
The state ended the fiscal year with a $74 billion General Fund balance, a $98 million decrease from the prior year’s ending fund balance.
This balance included $20.3 billion restricted for budget stabilization if the governor must declare a budget emergency during an economic crisis.
The state’s general revenues increased by $6.6 billion, or 2.9 percent, over the prior year. For the fiscal year, the state’s revenue exceeded expenses by $18.8 billion for governmental activities.
California had a net pension liability of $47.9 billion as of June 30, 2022 for governmental activities. The state had nearly $239.7 billion in total long-term obligations including bonds, pensions, loans, and leases.
This is the fifth consecutive ACFR that has been published late due to ongoing challenges in receiving financial statements from state departments and audited opinions from the California State Auditor.
The California State Auditor issued modified opinions on several components of the state’s basic financial statements because of these ongoing challenges.
Thanks to resources made available by the Legislature and Governor in the 2023-24 Budget, the State Controller’s Office is aggressively working toward its goal of publishing an on-time fiscal 2024-25 ACFR by March 2026.
The State Controller’s Office has moved quickly to permanently hire 13 new staff members with more in progress, bring in consultants, address technology needs, improve business processes, and compile resources that will assist departments with quickly responding to and resolving accounting issues.
“As my office continues to make meaningful progress toward restoring the timely issuance of this critical report, I remain grateful for the collaboration and support of the Legislature, the Governor’s administration and state department leaders, and control agencies in this effort,” said Controller Cohen.
The ACFR is prepared by the Controller’s team each year, adheres to generally accepted accounting principles and follows guidance from the Governmental Accounting Standards Board, or GASB.
Independently audited by the California State Auditor, the ACFR allows for apples-to-apples comparisons between entities and provides valuable financial information to the public, financial experts, and investors.
As the chief fiscal officer of California, Controller Cohen is responsible for accountability and disbursement of the state’s financial resources. The controller has independent auditing authority over government agencies that spend state funds.
LAKE COUNTY, Calif. — Lake County Economic Development Corp., in partnership with the Lake County Chamber of Commerce and the California Hispanic Chamber of Commerce, has announced the launch of a new program to assist Latino business owners and potential entrepreneurs.
El Centro Latino Del Lago is an ongoing business advising program, and its inaugural six-week training program launches March 27.
The training will include two networking events and six classroom training workshops and will be delivered exclusively in Spanish.
Program participants who successfully complete the courses, along with their families, will be invited to attend a graduation celebration on May 30th.
The first mixer will be March 27 at 6 p.m. at La Chilanguita in Clearlake. This free event will allow business owners to learn more about the program, meet the consultants from the California Hispanic Chamber of Commerce, or CAHCC, that will lead the workshops, and network with other Lake County Latino business owners. Refreshments will be provided.
Workshop topics include how to start a business, business planning, marketing, cost analysis and strategies for success.
For more information, and to sign up, visit: https://lakecountycaedc.org/centro-latino-del-lago/.
This program is supported by the FHL of San Francisco, in partnership with Vocality Credit Union.
Funded in part through a Grant or cooperative agreement with the U.S. Small Business Administration and the Governor’s Office of Business and Economic Development.
La Corporación de Desarrollo Económico del Condado de Lake (Lake EDC), en asociación con la Cámara de Comercio del Condado de Lake (LCCC) y la Cámara de Comercio Hispana de California (CAHCC), se complace en anunciar el lanzamiento de un nuevo programa para ayudar a los propietarios y potenciales empresarios latinos.
El Centro Latino Del Lago es un programa continuo de asesoramiento empresarial y su programa inaugural de capacitación de seis semanas se lanza el 27 de marzo. La capacitación incluirá dos eventos de networking y seis talleres de capacitación presenciales que se impartirán exclusivamente en español. Los participantes del programa que completen exitosamente los cursos, junto con sus familias, serán invitados a asistir a una celebración de graduación el 30 de mayo.
La primera reunión será el 27 de marzo a las 6:00 de la tarde, en La Chilanguita en Clearlake. Este evento gratuito permitirá a los dueños de negocios aprender más sobre el programa, conocer a los consultores de CAHCC que dirigirán los talleres y establecer contactos con otros dueños de negocios latinos del condado de Lake. Se proporcionarán refrigerios.
Los temas del taller incluyen cómo iniciar un negocio, planificación empresarial, marketing, análisis de costos y estrategias para el éxito. Para obtener más información y registrarse, visite: https://lakecountycaedc.org/centro-latino-del-lago/.
Este programa cuenta con el apoyo de FHL de San Francisco, en asociación con Vocality Credit Union. Financiado en parte a través de una subvención o acuerdo cooperativo con la Administración de Pequeñas Empresas de EE. UU. y la Oficina de Desarrollo Económico y Empresarial del Gobernador.
A new study published in The Lancet reveals never-before-seen details about staggeringly high mortality from the COVID-19 pandemic within and across countries.
Places such as Mexico City, Peru and Bolivia had some of the largest drops in life expectancy from 2019 to 2021.
The research, which presents updated estimates from the Global Burden of Disease Study 2021, provides the most comprehensive look at the pandemic’s toll on human health to date, indicating that global life expectancy dropped by 1.6 years from 2019 to 2021, a sharp reversal from past increases.
Among other key findings from the Global Burden of Disease, or GBD, child mortality continued to drop amid the COVID-19 pandemic, with half a million fewer deaths among children under 5 in 2021 compared to 2019. Mortality rates among children under 5 decreased by 7% from 2019 to 2021.
“For adults worldwide, the COVID-19 pandemic has had a more profound impact than any event seen in half a century, including conflicts and natural disasters,” says co-first author Dr. Austin E. Schumacher, acting assistant professor of Health Metrics Sciences at the Institute for Health Metrics and Evaluation, or IHME, at the University of Washington. “Life expectancy declined in 84% of countries and territories during this pandemic, demonstrating the devastating potential impacts of novel pathogens.”
Researchers from IHME identified high mortality during the COVID-19 pandemic in places that were previously less recognized and/or reported.
For example, the study reveals that after accounting for the age of the population, countries such as Jordan and Nicaragua had high excess mortality due to the COVID-19 pandemic that was not apparent in previous all-age excess mortality estimates.
In analyzing subnational locations not previously investigated, the South African provinces of KwaZulu-Natal and Limpopo had among the highest age-adjusted excess mortality rates and largest life expectancy declines during the pandemic in the world.
Conversely, the places with some of the lowest age-adjusted excess mortality from the pandemic during this period included Barbados, New Zealand, and Antigua and Barbuda.
During the COVID-19 pandemic, mortality among older people worldwide rose in ways unseen in the previous 70 years. While the pandemic was devastating, killing approximately 16 million people around the globe in 2020 and 2021 combined, it did not completely erase historic progress — life expectancy at birth rose by nearly 23 years between 1950 and 2021.
GBD 2021 analyzes past and current demographic trends at global, regional, national, and subnational levels.
The study provides globally comparable measures of excess mortality and is one of the first studies to fully evaluate demographic trends in the context of the first two years of the COVID-19 pandemic.
In estimating excess deaths due to the pandemic, the authors accounted for deaths from the virus that causes COVID-19, SARS-CoV-2, as well as deaths associated with indirect effects of the pandemic, such as delays in seeking health care.
Employing innovative methods to measure mortality, excess mortality from the COVID-19 pandemic, life expectancy, and population, the study authors estimate that the pandemic caused global mortality to jump among people over age 15, rising by 22% for males and 17% for females from 2019 to 2021.
GBD 2021 goes beyond assessing the impact of the first two years of the COVID-19 pandemic. As the authors note, it also offers “implications for the future of health-care systems, economies, and societies and ... a valuable foundation for policy evaluation, development, and implementation around the world.”
GBD 2021 indicates that, despite early warnings that COVID-19 could threaten the gains that the world had made in saving children’s lives, these improvements continued during the pandemic, albeit at a slower pace.
Still, stark differences in child mortality persist between regions. In 2021, one out of every four children who died worldwide lived in South Asia, while two out of every four children who died lived in sub-Saharan Africa.
“Our study suggests that, even after taking stock of the terrible loss of lives the world experienced due to the pandemic, we have made incredible progress over 72 years since 1950, with child mortality continuing to drop globally,” said co-first author Dr. Hmwe Hmwe Kyu, Associate Professor of Health Metrics Sciences at IHME at the University of Washington. “Now, continuing to build on our successes, while preparing for the next pandemic and addressing the vast disparities in health across countries, should be our greatest focuses.”
The GBD 2021 study also assessed population trends. Beginning in 2017, the rate of global population growth began to drop following years of stagnation. Then, during the COVID-19 pandemic, these declines accelerated.
As of 2021, 56 countries have reached peak population. Now, these countries are seeing their populations shrink. However, rapid population growth has continued in many lower-income countries. In addition, populations around the world are aging.
Between 2000 and 2021, the number of people who were 65 and older grew faster than the number of people under age 15 in 188 countries and territories.
“Slowing population growth and aging populations, along with the concentration of future population growth shifting to poorer locations with worse health outcomes, will bring about unprecedented social, economic, and political challenges, such as labor shortages in areas where younger populations are shrinking and resource scarcity in places where population size continues to expand rapidly,” says Dr. Schumacher. “This is worth restating, as these issues will require significant policy forethought to address in the affected regions. As one example, nations around the world will need to cooperate on voluntary emigration, for which one source of useful guidance is the UN’s Global Compact for Safe, Orderly and Regular Migration.”
Nirav Pandya, University of California, San Francisco
Along with ankle injuries, kids focusing on one sport tend to have more shoulder and knee issues, including ACL injuries. LSOphoto/iStock via Getty Images Plus
From football to baseball, gymnastics to tennis, more young athletes are becoming sports specialists. They join expensive sports clubs or youth leagues and devote themselves to a single sport all year long. But Nirav Pandya, a professor of orthopedic surgery and sports medicine at the University of California San Francisco, says there are risks when kids specialize, including an increased possibility of injury and a high burnout rate.
Dr. Nirav Pandya discusses the problems that can occur when kids specialize in one sport.
The Conversation has collaborated with SciLine to bring you highlights from the discussion, which have been edited for brevity and clarity.
What trends do you see related to kids and sports participation?
Also, in the long term, kids who specialize in a single sport perform less well in that sport and in all sports in general than kids who play more than one. So once again, we’re really hurting kids from multiple different levels if they’re specializing.
What is the relationship between sports specialization and injuries?
Nirav Pandya: There’s a tremendous increase in traumatic injuries. ACL tears used to be something we’d see in 17-, 18-, 19-year-olds. Now, 10-, 11- and 12-year-olds get them. The rate of ACL injuries has gone up 12% over the last decade in this adolescent age group.
Based on my experience as a clinician, kids are also getting overuse injuries like knee pain and shoulder pain from doing too much of the same activity again and again.
Are clubs and leagues costly?
Nirav Pandya: The Aspen Institute has shown that families will spend, on average, about $1,000 per year for these travel or private club sports. That’s a big financial burden for a lot of families.
In addition, the reason why a lot of families are doing this is because they want their kids to get a college scholarship. Colleges are very expensive, and parents think if their child specializes in a sport and plays on these club teams, they can get to that level.
Nirav Pandya: You have one group of kids who have access to sports because their families have the money and those kids are getting injured. And then you have another group of kids whose families don’t have the money to participate, and therefore there isn’t really an outlet for them to be physically active because school funding is going down. Recreational programs don’t exist. So then those kids get the problems of diabetes, obesity and hypertension, and they carry that into adulthood.
What can parents do to ensure their kids have a healthy relationship with sports?
Nirav Pandya: It’s important for parents to understand the data. And that’s our role as physical therapists, athletic trainers and coaches – to understand that data and give it to parents.
I think the second thing is also not to feel the pressure to enter the youth sports complex, a US$15.3 billion industry. Instead, donate to a community organization that is funding recreational sports, or try to push for your school to have those opportunities for your kids.
And finally, if your child is going to be playing travel sports or year-round sports, the parents should look at the websites of the club. Are they promoting kids to be healthy and active in a safe environment, or are they promoting kids to get a scholarship?
SciLine is a free service based at the nonprofit American Association for the Advancement of Science that helps journalists include scientific evidence and experts in their news stories.
School meals are critical to child health. Research has shown that school meals can be more nutritious than meals from other sources, such as meals brought from home.
A recent study that one of us conducted found the quality of school meals has steadily improved, especially since the 2010 Healthy, Hunger-Free Kids Act strengthened nutrition standards for school meals. In fact, by 2017, another study found that school meals provided the best diet quality of any major U.S. food source.
Many American families became familiar with universal free school meals during the COVID-19 pandemic. To ease the financial and logistical burdens of the pandemic on families and schools, the U.S. Department of Agriculture issued waivers that allowed schools nationwide to provide free breakfast and lunch to all students. However, these waivers expired by the 2022-23 school year.
Since that time, there has been a substantial increase in schools participating in the Community Eligibility Provision, a federal policy that allows schools in high poverty areas to provide free breakfast and lunch to all attending students. The policy became available as an option for low-income schools nationwide in 2014 and was part of the Healthy, Hunger-Free Kids Act. By the 2022-23 school year, over 40,000 schools had adopted the Community Eligibility Provision, an increase of more than 20% over the prior year.
Many families felt stressed when a federal program providing free school meals during the pandemic came to an end.
President Harry Truman established the National School Lunch Program in 1946, with the stated goal of protecting the health and well-being of American children. The program established permanent federal funding for school lunches, and participating schools were required to provide free or reduced-price lunches to children from qualifying households. Eligibility is determined by income based on federal poverty levels, both of which are revised annually.
In 1966, the Child Nutrition Act piloted the School Breakfast Program, which provides free, reduced-price and full-price breakfasts to students. This program was later made permanent through an amendment in 1975.
The Community Eligibility Provision was piloted in several states beginning in 2011 and became an option for eligible schools nationwide beginning in 2014. It operates through the national school lunch and school breakfast programs and expands on these programs.
Various federal and state programs have sought to make food more accessible to children.John Moore/Getty Images
The policy allows all students in a school to receive free breakfast and lunch, rather than determine eligibility by individual households. Entire schools or school districts are eligible for free lunches if at least 40% of their students are directly certified to receive free meals, meaning their household participated in a means-based safety net program, such as the Supplemental Nutrition Assistance Program, or the child is identified as runaway, homeless, in foster care or enrolled in Head Start. Some states also use Medicaid for direct certification.
The Community Eligibility Provision increases school meal participation by reducing the stigma associated with receiving free meals, eliminating the need to complete and process applications and extending access to students in households with incomes above the eligibility threshold for free meals. As of 2023, the eligibility threshold for free meals is 130% of the federal poverty level, which amounts to US$39,000 for a family of four.
Universal free meals and obesity
We analyzed whether providing universal free meals at school through the Community Eligibility Provision was associated with lower childhood obesity before the COVID-19 pandemic.
To do this, we measured changes in obesity prevalence from 2013 to 2019 among 3,531 low-income California schools. We used over 3.5 million body mass index measurements of students in fifth, seventh and ninth grade that were taken annually and aggregated at the school level. To ensure rigorous results, we accounted for differences between schools that adopted the policy and eligible schools that did not. We also followed the same schools over time, comparing obesity prevalence before and after the policy.
We found that schools participating in the Community Eligibility Provision had a 2.4% relative reduction in obesity prevalence compared with eligible schools that did not participate in the provision. Although our findings are modest, even small improvements in obesity levels are notable because effective strategies to reduce obesity at a population level remain elusive. Additionally, because obesity disproportionately affects racially and ethnically marginalized and low-income children, this policy could contribute to reducing health disparities.
The Community Eligibility Provision likely reduces obesity prevalence by substituting up to half of a child’s weekly diet with healthier options and simultaneously freeing up more disposable income for low-to-middle-income families. Families receiving free breakfast and lunch save approximately $4.70 per day per child, or $850 per year. For low-income families, particularly those with multiple school-age children, this could result in meaningful savings that families can use for other health-promoting goods or services.
Growing research is showing the benefits of universal free school meals for the health and well-being of children. Along with our study of California schools, other researchers have found an association between universal free school meals and reduced obesity in Chile, South Korea and England, as well as among New York City schools and school districts in New York state.
While our research observed a reduction in the prevalence of obesity among schools participating in the Community Eligibility Provision relative to schools that did not, obesity increased over time in both groups, with a greater increase among nonparticipating schools.
Universal free meals policies may slow the rise in childhood obesity rates, but they alone will not be sufficient to reverse these trends. Alongside universal free meals, identifying other population-level strategies to reduce obesity among children is necessary to address this public health issue.
As of 2023, several states have implemented their own universal free school meals policies. States such as California, Maine, Colorado, Minnesota and New Mexico have pledged to cover the difference between school meal expenditures and federal reimbursements. As more states adopt their own universal free meals policies, understanding their effects on child health and well-being, as well as barriers and supports to successfully implementing these programs, will be critical.
The gender wage gap — the difference between what men and women earn — is an often-cited marker of the progress women are making in the work force typically measured by comparing the average earnings of men and women.
Previous U.S. Census Bureau research has explored the gender wage gap and how it varies with social, economic and demographic characteristics.
Now, new U.S. Census Bureau research takes it a step further by comparing male and female earnings for graduates of similar educational programs. Rather than comparing male and female wages and controlling for education, it looks at the earnings of men and women with the same level and quality of education.
This research provides new information about the gender pay gap across a range of postsecondary education levels from graduates of the most selective bachelor programs to graduates of certificate programs.
The Census Bureau analyzed the earnings of graduates from certificate, associate and bachelor’s programs for up to 15 years. It estimated the magnitude of the earnings gap at these educational levels and three factors that may contribute to it: field of study; occupation and industry after graduation; and number of weeks and hours worked in a year.
This research was made possible by a partnership between the Census Bureau and state higher education systems, which provided student transcript records that can be linked to other datasets.
In this case, the student records were linked to the American Community Survey (ACS) to gauge post-graduation outcomes such as earnings, occupation, childbearing, and the number of weeks and hours worked. The ACS is the premier source of detailed population and housing information about our nation.
Researchers analyzed the gender pay gap using a statistical model that answered the following questions for each degree level considered:
• How large was the gap between men’s and women’s earnings, on average? • How much of this gap was driven by women and men majoring in different fields? • Among women and men with the same education level who graduated in the same field, how much of the gap stemmed from women and men working in different occupations and industries? • Among men and women with the same education level, who graduated in the same field and worked in the same occupation, how much of the gap was caused by women and men participating in the workforce at different rates and working different numbers of weeks and hours-per-week during the year? • How much of the gender pay gap was due to other factors?
Answers differed considerably depending on whether someone graduated from a certificate or selective bachelor’s program.
The size of the gender earnings gap
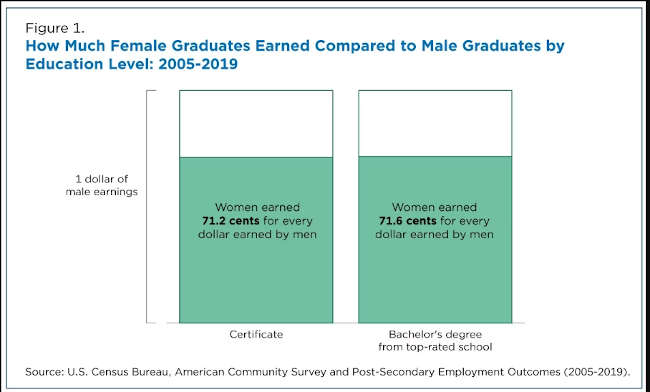
The gap in average earnings from 2005 to 2019 was consistent across all education levels. As shown in Figure 1, women with a certificate degree earned 71.2 cents for every dollar earned by men with a certificate degree. In other words, the gap was 28.8%. For graduates of the most selective bachelor’s institutions, as defined by the Barron’s Admissions Competitiveness Index, the gap was 28.4%.
This gap is larger than the 84 cents for every dollar earned figure reported by the White House, which compares full-time, year-round working men and women. The comparisons in this report are between graduates.
Field of study
College major or field of study accounted for a substantial portion of the gap at higher education levels but were less significant at lower levels.
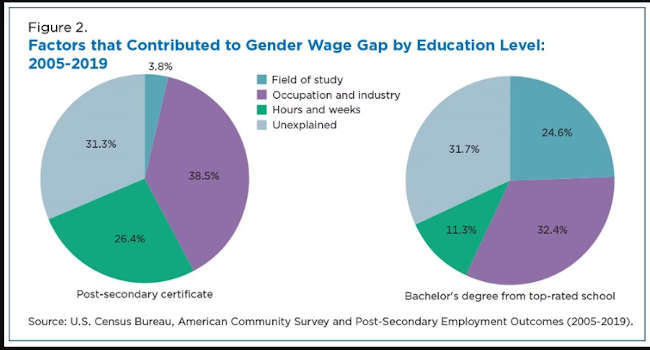
For example, 3.8% of the gender gap in earnings among those with certificate degrees was attributed to choice of major/field of study, compared to 24.6% among graduates of the most selective bachelor’s programs (Figure 2).
After accounting for differences in choice of major, the share of the gap due to occupation and industry chosen was nearly the same regardless of education level.
Occupational choices accounted for 38.5% of the gap among certificate degree graduates and 32.4% of the gap among graduates of selective bachelor’s programs (Figure 2).
Differences in labor supply — which reflect a combination of gender differences in employment rates as well as gender differences in the number of weeks and hours-per-week worked in a year of those employed — had a greater impact on the pay gap among graduates of certificate and associate programs than among those with bachelor’s degrees.
Labor supply accounted for 26.4% of the pay gap among certificate holders but only 11.3% among graduates of the most selective bachelor’s programs (Figure 2).
In Figures 2 and 4, the “unexplained” is the share of the gap that is not explained by differences in field of study, occupation and industry, or hours and weeks worked.
The children factor
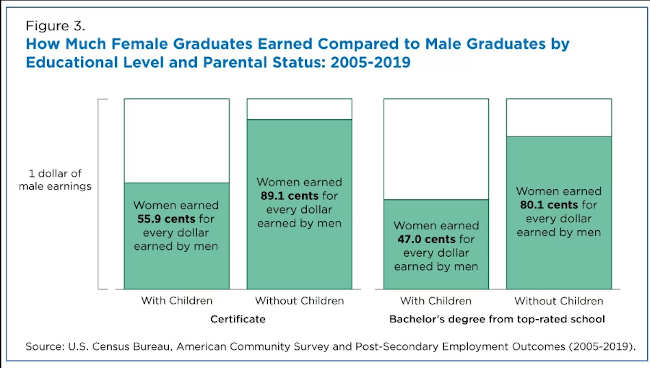
Previous research has shown that having children contributed significantly to the gender pay gap.
And as Figure 3 shows, this study found the wage gap was considerably wider among men and women with than without children — more than double for top bachelor’s holders and quadruple for certificate graduates.
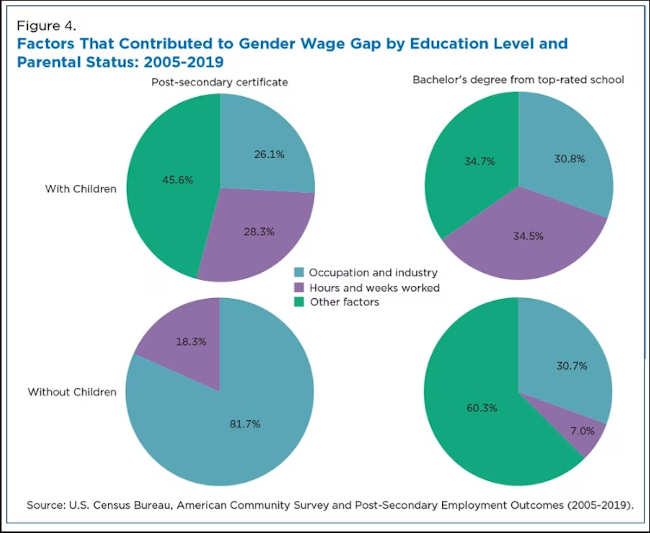
Figure 4 illustrates this jump was mostly fueled by labor supply among graduates of certificate programs and by occupation and labor supply choices among grads of highly selective bachelor’s programs.
Gender pay gap varied across the educational attainment distribution
Until recently, data limitations prevented researchers from investigating variations in the gender pay gap across different types of degrees and paths taken by graduates.
Thanks to our partnership with higher education systems, we can now get to the bottom of whether and how the gender pay gap relates to types of degrees earned.
The results paint a more complex portrait of the gender pay gap, found to exist at every level. College graduates and policymakers can use this more detailed information to better understand and dismantle contemporary barriers to gender equality.
Ariel Binder, Amanda Eng and Kendall Houghton are economists in the Center for Economic Studies Demographic Research Area. Andrew Foote is a principal economist in the Center for Economic Studies LEHD Research Area. All are U.S. Census Bureau staffers.
CLEARLAKE, Calif. — The Clearlake City Council will meet this week to discuss taking actions in support of a housing developer’s applicant for grant funding and a municipal code update to support an increase in fire district mitigation fees.
The council will meet at 5 p.m. Thursday, March 21, in the council chambers at Clearlake City Hall, 14050 Olympic Drive, for a closed session for a performance evaluation of City Manager Alan Flora and discussion of a claim against the city before the regular meeting starts at 6 p.m.
Community members also can participate via Zoom. The pass code is 064363. One tap mobile is available at +16694449171,,84845472024#, or join by phone at 669-444-9171 or 253-205-0468.
Under business, council members will consider a resolution supporting the application of Chelsea Investment for the HOME Investment Partnerships Grant Program for development of affordable housing at 15837 18th Ave.
The project in question is on a property the county of Lake traded to the state in exchange for the former Lakeport Armory, which is slated to become the new headquarters of the Lake County Sheriff’s Office.
Chelsea Investments, the developer the state selected for the project, wants to build an 80-unit project but the staff report said the developer has “struggled to complete the funding stack needed to begin construction and is looking to apply for $10 million in HOME funds to fill part of the gap. The City would be the applicant for the funds on behalf of the project and Chelsea Investment.”
Also on Thursday, the council will hold a public hearing to consider Clearlake Municipal Code section updates to modify Lake County Fire Protection District fire mitigation fees and set the first reading on April 4.
The council also will receive presentations on March's Adoptable Dogs and the annual report from the Lake County Public, Education, and Government Channel, or PEG TV.
On the meeting's consent agenda — items that are considered routine in nature and usually adopted on a single vote — are warrants, minutes of the Feb. 14 Lake County Vector Control District Board meeting, authorization for the police chief to dispose of three vehicles through a dismantler, sell one vehicle at auction and adopt Resolution No. 2024-12, the Clearlake Waste Solutions 2022 Annual Solid Waste and Recycling Report and adoption of Resolution 2024-13 approving an amendment to the standard agreement issued under the 2020 Community Development Block Grant Program Coronavirus Response.
Email Elizabeth Larson at This email address is being protected from spambots. You need JavaScript enabled to view it.. Follow her on Twitter, @ERLarson, or Lake County News, @LakeCoNews.
LAKE COUNTY, Calif. — The Board of Supervisors this week will get a report on the status of a sewer improvement project meant to mitigate the impacts of a new Clearlake apartment complex development.
The board will meet beginning at 9 a.m. Tuesday, March 19, in the board chambers on the first floor of the Lake County Courthouse, 255 N. Forbes St., Lakeport.
The meeting ID is 898 7006 8634, pass code 694057. The meeting also can be accessed via one tap mobile at +16699006833,,83106989699#,,,,*694057#. The meeting can also be accessed via phone at 669 900 6833.
In an item timed for 9:10 a.m., the board will get a report on the current status of the Konocti Gardens project and the Special Districts sewer improvement project on Alvita Avenue in Clearlake to mitigate the development impacts.
The staff report said Konocti Gardens is a 102-unit multifamily apartment complex development off of Old Highway 53 near Highlands Way.
Construction on Special Districts’ improvement project is anticipated to occur this summer and to be completed by fall, staff reported.
The full agenda follows.
CONSENT AGENDA
5.1: Approve revised letter of support for California Coastal Conservancy LiDAR Derivatives Funding and authorize the chair to sign.
5.2: Approve Amendment No. 2 to the agreement between county of Lake and Redwood Community Services Inc. for the Lake County WRAP Program, Foster Care Program, and Intensive Services Foster Care (ISFC) Program for Specialty Mental Health Services with no change to the contract maximum for fiscal years 2022-23, 2023-24, and 2024-25 and authorize the board chair to sign.
5.3: Approve Board of Supervisors minutes from March 5 and March 12, 2024.
5.4: Approve purchase of one vehicle from Downtown Ford through the state contract, in the amount of $57,374.76, and authorize the probation chief to issue purchase order.
5.5: Approve purchase of two vehicles from Downtown Ford – Sacramento in the amount of $57,347.76 each for the Central Garage fleet and authorize the Public Works director/assistant purchasing agent to issue the purchase orders.
5.6: Approve Change Order No. 2, for FEMA FMAG Culvert Replacement No. 3 Project, Federal Project No.’s FMAG DR 5189-FM-CA, Bid No. 21-04, for an increase of $17,524.28 and a revised contract amount of $264,261.58, and authorize the chair to sign.
5.7: Approve Judicial Advocate General Grant #15PBJA-21-GG-01104-JAGX decline letter and authorize chair to sign.
TIMED ITEMS
6.2, 9:03 a.m.: Pet of the Week.
6.3, 9:04 a.m.: Presentation considering annual delinquent sewer and water tax roll schedule and established staff direction from Board of Supervisors.
6.4, 9:10 a.m.: Consideration of report to the board on the current status of the Konocti Gardens project and the Special Districts sewer improvement project on Alvita Avenue in Clearlake to mitigate the development impacts.
6.5: Continued from Feb. 6, 9:45 a.m., public hearing, consideration of an ordinance amending the Purchasing Ordinance: Article X of Chapter Two of the Lake County Code to include increased purchasing limits, additional definitions, modify requirements for exemptions from competitive bidding and additional procedures for informal and formal bidding.
6.6, 10 a.m.: Consideration of a presentation from Nielsen Merksamer on the 2024 legislative session, state budget and potential bills of interest.
6.7, 10:15 a.m.: Public hearing, (a) consideration of resolution approving an application for funding and the execution of a grant agreement and any amendments thereto from the 2023-2024 Funding Year of the State CDBG Mitigation Resilience Infrastructure (MIT-RIP) Program; and (b) authorize the county administrative officer or designee to submit the grant application.
UNTIMED ITEMS
7.2: Consideration of appointment to the East Region Town Hall.
7.3: Consideration of general fund loan request of $3,000,000 and loan of $1,000,000 from Department of Social Services Realignment Fund.
7.4: Consideration of resolution approving a short-term loan from the general fund by way of the Technology Reserve, Fund 154, to Behavioral Health Services, Fund 145, in the amount of $3,000,000.
7.5: Consideration of Amendment No. 2 to the agreement between the Lake County Behavioral Health Services as lead administrative entity for the Lake County Continuum of Care and Adventist Health Clear Lake Hospital Inc. in the amount of $443,000 for fiscal years 2021-2024 and authorize the board chair to sign.
CLOSED SESSION
8.1: Public employee evaluation: Public Services director.
8.2: Addendum, conference with legal counsel: Existing Litigation pursuant to Gov. Code sec. 54956.9 (d)(1) – FERC Project No. 77, Potter Valley Hydroelectric Project.
Email Elizabeth Larson at This email address is being protected from spambots. You need JavaScript enabled to view it.. Follow her on Twitter, @ERLarson, or Lake County News, @LakeCoNews.
The U.S. Congress designated March as Irish American Heritage Month in 1991 and the president issues a proclamation commemorating the occasion each year.
Originally a religious holiday to honor St. Patrick who introduced Christianity to Ireland in the fifth century, St. Patrick’s Day has evolved into a celebration of all things Irish.
The world’s first St. Patrick’s Day parade occurred on March 17, 1762, in New York City, featuring Irish soldiers who served in the English military. This parade became an annual event, with President Truman attending in 1948.
The following facts are made possible by the invaluable responses to U.S. Census Bureau surveys.
Did You Know?
30.7 million or 9.2% The number and percentage of U.S. residents who claimed Irish ancestry in 2022.
112,251 The number of foreign-born U.S. residents who reported Ireland as their birthplace in 2022.
418,997 The number of people living in Cook County, Illinois — the nation’s county with the largest Irish American population — who claimed Irish ancestry in 2022.
11.1% The percentage of residents in Lake County, California, who claim Irish heritage. That makes Irish the third-largest ancestry claimed by county residents, following German (15.5%) and English (11.9%).

 How to resolve AdBlock issue?