Barbara Guzzi. Courtesy photo. LAKE COUNTY, Calif. — The Clearlake Police Department said it is trying to locate a woman missing since the weekend.
Barbara Jean Guzzi, 58, was last seen on Saturday at 1 p.m. when she was leaving the San Jose area in a white Nissan Murano. She was enroute to the city of Clearlake.
Guzzi suffers from medical conditions and is considered at risk.
She is a white female, 5 feet 6 inches tall and 130 pounds, with shoulder length blonde hair and blue eyes.
Guzzi was last seen wearing a black jacket, blue jeans, brown boots and was wearing three silver rings on each hand.
If you have any information regarding Guzzi’s whereabouts, please contact the Clearlake Police Department at 707-994-8251, Extension 1.
LAKE COUNTY, Calif. — Frosty overnight temperatures early in the week and chances of rain beginning on Tuesday night are in Lake County’s forecast this week.
The National Weather Service issued a frost warning for early Sunday morning, when temperatures are expected to be in the low to mid 30s.
Nighttime temperatures are expected to stay mostly in the 30s later this week.
However, daytime temperatures around Lake County this week will be more pleasant, falling in the high 50s and low 60s.
From Tuesday through Saturday, forecasters said there are chances of rain, with daytime temperatures in the low 50s.
While there is an expectation of rain this week, the long-term forecast says there is a better chance of precipitation next week.
Email Elizabeth Larson at This email address is being protected from spambots. You need JavaScript enabled to view it.. Follow her on Twitter, @ERLarson, or Lake County News, @LakeCoNews.
“Smiley.” Photo courtesy of Clearlake Animal Control.
CLEARLAKE, Calif. — Clearlake Animal Control has a variety of dogs waiting for their new homes.
The Clearlake Animal Control website lists 45 adoptable dogs.
They include “Smiley,” a male pit bull terrier mix with a gray and white coat.
“Monkey.” Photo courtesy of Clearlake Animal Control. Also available for adoption is “Monkey,” a 1-year-old female pit bull mix.
The shelter is located at 6820 Old Highway 53. It’s open from 9 a.m. to 6 p.m. Tuesday through Saturday.
For more information, call the shelter at 707-762-6227, email This email address is being protected from spambots. You need JavaScript enabled to view it., visit Clearlake Animal Control on Facebook or on the city’s website.
This week’s adoptable dogs are featured below.
Email Elizabeth Larson at This email address is being protected from spambots. You need JavaScript enabled to view it.. Follow her on Twitter, @ERLarson, or Lake County News, @LakeCoNews.
The number of people who moved between states rose from nearly 7.9 million people in 2021 to approximately 8.2 million people in 2022, according to newly released U.S. Census Bureau estimates.
The American Community Survey (ACS) shows state-to-state movers also made up a larger share of all movers between 2021 and 2022, increasing from 18.8% to 19.9%.
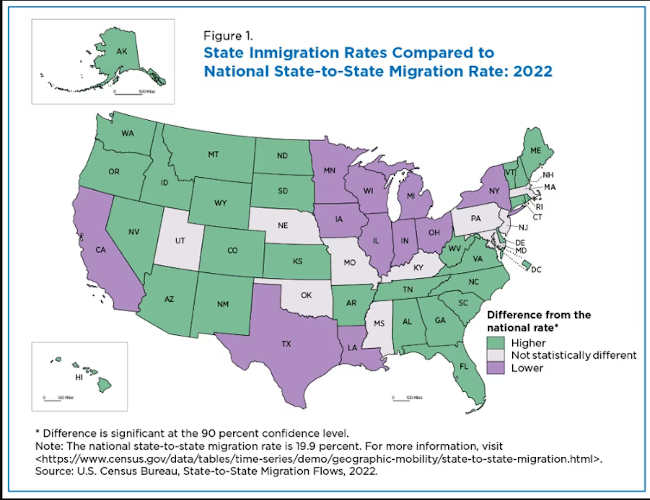
Inmigration rates — the number of people moving into a state as a share of that state’s total number of movers — were higher than the national state-to-state migration rate of 19.9% for states concentrated in the South and West.
This increase in the number and share of state-to-state movers continued a decade-long trend of rising state-to-state migration even as overall migration has declined. Between 2021 and 2022, the overall national migration rate – the number of movers in the United States relative to the population age 1 year and over – dropped from 12.8% to 12.6%.
The Census Bureau regularly publishes estimates of state-to-state migration flows. Estimates are based on 1-year data from the 2022 ACS. The ACS asks respondents who moved in the past year to report their previous place of residence, allowing us to assess migration between origin and destination geographies.
By examining state-to-state migration patterns, we can better understand resources needed in response to changes in states’ demographic, social and economic profiles.
Inmigration rates
Inmigration rates — the number of people moving into a state as a share of that state’s total number of movers — were higher than the national state-to-state migration rate of 19.9% for states concentrated in the South and West (Figure 1).
The District of Columbia had one of the highest (44.3%) inmigration rates. Most (13,093) people moving into the District of Columbia arrived from neighboring Maryland.
California had the lowest (11.1%) inmigration rate. Despite a relatively large number of in-movers, California also had a relatively large base of movers overall, helping to explain the state’s low inmigration rate. Most (44,279) people moving to California arrived from Texas.
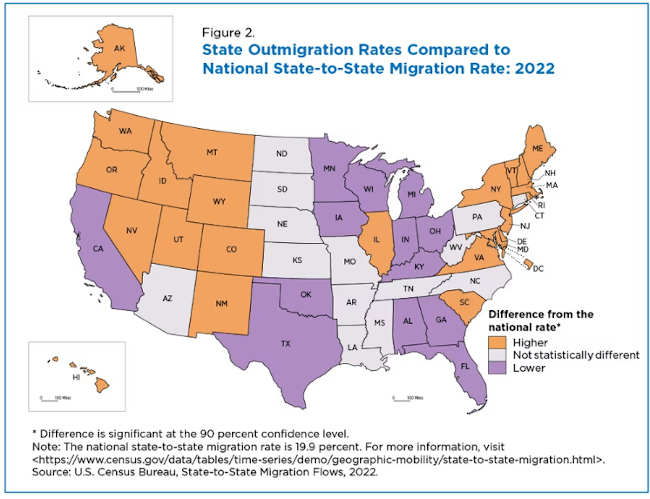
Outmigration rates
Outmigration rates — the number of people moving out of a state as a share of that state’s total number of movers — tended to be higher than the national state-to-state migration rate for states in the Northeast and West (Figure 2).
The District of Columbia had the highest (46.6%) outmigration rate, with most people moving to neighboring Maryland (17,770) or Virginia (13,582).
Texas had the country's lowest (11.7%) outmigration rate, with most of those who did move relocating to California (42,479) or Florida (38,207).
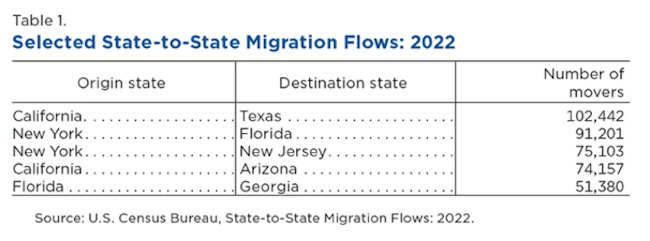
Notable state-to-state migration flows
Some of the largest state-to-state migration flows in 2022 involved people moving to and from highly populated states (Table 1). The two largest flows, which were not statistically different from each other in size, came either to or from the four most populous states: large numbers of people moved from California to Texas and from New York to Florida.
Other large state-to-state migration flows involved people moving from highly populated to neighboring states. For example, many people moved from New York, the fourth most populous state, to New Jersey.
All estimates are for the population age 1 year and over. Estimates of national and state-level migration rates reflect people who moved between states and the District of Columbia relative to all movers, including people who moved from Puerto Rico and abroad. Estimates of state-to-state migration flows reflect people who moved between the states and the District of Columbia.
Mehreen Ismail is a survey statistician in the Census Bureau’s Social, Economic, and Housing Statistics Division.
Ayalla A. Ruvio, Michigan State University and Forrest Morgeson, Michigan State University
With two big shopping days on the horizon – Black Friday and Cyber Monday – U.S. retailers are getting ready for the most important time of the year. The stakes are high: For some companies, the holiday shopping season accounts for 50% of annual revenue. But economic uncertainty and recent inflation could put a damper on customers’ holiday spending, our new research suggests.
As marketingprofessors, we know that consumer spending drives the U.S. economy. So for the second year in a row, we surveyed more than 500 Americans about their holiday shopping plans. We found that consumers are conflicted: They’re excited for deals and looking forward to treating themselves, but they’re feeling squeezed by high prices.
Consumers are starting the season cautiously optimistic …
When it comes to Black Friday and Cyber Monday, two-thirds of respondents say they think deals will be as good as or better than they were last year — up from 56% in 2022. That’s in line with the predictions of market research firm Adobe Analytics, which expects record discounts this year.
Shoppers also plan to splurge a little on Black Friday and Cyber Monday. The share who plan to prioritize shopping for necessities fell slightly from 2022, while those who plan to buy luxury items rose modestly. Meanwhile, plans to spend on big-ticket items stayed stable at 15%.
Despite a minor shift to more expensive items, these findings are concerning for retailers. That’s because big-ticket items have historically been one of the top three categories for consumers spending money on Black Friday and Cyber Monday, and 15% is on the low side.
Like in 2022, the majority of consumers we surveyed — 68.2% — plan to shop mostly online. Fewer than 11% of the respondents in our survey said they plan to shop in-store this Black Friday, so malls may suffer from lower foot traffic.
… but they’re still acting like there’s a recession
Last year, despite the brightening economic outlook, we found that customers were pinching pennies and otherwise behaving in ways most commonly seen in times of economic crisis. This year, inflation-fatigued consumers plan to do much the same.
High prices and inflation are still consumers’ main concerns, with roughly 90% of our respondents saying that those issues will affect their holiday shopping. On average, they plan to spend about US$665 on gifts this holiday season — about $35 less than last year, and substantially less than the National Retail Federation’s 10-year average of $826.
On a more optimistic note, the number of people who said they intend to spend “slightly less” or “much less” than last year fell to 24.2% this year — a 10-percentage-point drop from 2022. While nearly 39% of respondents said they will spend “about the same” amount, in nominal terms this means that they will be spending less accounting for inflation.
As usual, all eyes are on the American consumer this holiday season.Ted Shaffrey/AP Photo
Meanwhile, shoppers seem to be budget-planning more than ever. Customers told us they plan to use a variety of strategies to control their purchases, such as strict shopping lists and starting shopping earlier to spread their spending out.
However, we found a silver lining for retailers: While consumers are planning to spend less this year, they expressed more interest in brand names and expensive gifts, which tend to have higher profit margins.
One notable change from 2022 is that more customers think retailers will offer “great value.” This indicates that while consumers are looking for the best prices and affordable options, they aren’t necessarily looking for cheap products.
In times of economic uncertainty, consumers want to stay in control of their spending. So it’s not surprising that almost 50% of our respondents said they would be doing their holiday spending using funds they’d saved for that purpose. A similar proportion said they plan to use credit cards.
However, the use of buy-now, pay-later options is stagnating at about 15%, even though many big retailers have adopted them. This suggests that even though these options are more readily available to consumers, budget-conscious shoppers may be avoiding them.
That makes sense, given the broader economic context. Although the U.S. unemployment rate is relatively low at 3.9%, more than half of our survey respondents said they were worried about their job security, with about one-third saying they were “moderately” or “severely” worried. Only 13% said they had no financial concerns at all.
As the U.S. economy is still experiencing uncertainty, consumers are continuing to adopt recession-related shopping behaviors this holiday season. That means retailers would be wise to focus on providing true value.
The California Highway Patrol was awarded a federal grant to support its yearlong education and enforcement efforts to help improve pedestrian and bicyclist safety throughout the state.
The Bicycle and Pedestrian Safety, Education, Enforcement, and Awareness Program II, which continues through Sept. 30, 2024, is designed to help educate and enforce traffic safety laws for drivers, bicyclists, and pedestrians.
“Safe streets are built on shared responsibility, where motorists, bicyclists, and pedestrians all play a key role in ensuring each trip ends with a safe arrival,” said CHP Commissioner Sean Duryee. “This grant is an investment in helping improve the safety of California’s most vulnerable roadway users.”
In California, pedestrian and bicyclist fatalities account for 20 percent of all traffic-related deaths in CHP jurisdiction.
Pedestrians and bicyclists make up 1,519 of the 7,559 people killed in crashes between 2020 and 2022 throughout CHP jurisdiction.
In the spirit of sharing the road, the CHP offers the following suggestions:
Drivers
• Adhere to the posted speed limit and exercise caution on busy streets with more bicyclists and pedestrians. • Stay focused on driving and eliminate distraction behind the wheel. • Yield to pedestrians and stop for people walking at marked and unmarked crosswalks. • Show consideration for cyclists by maintaining 3 feet of distance when safely passing them. Change lanes when possible.
Pedestrians
• Stay alert to oncoming vehicles. • Use crosswalks when available, especially at stop signs or signals. Exercise caution when crossing at night or when navigating busier streets with multiple lanes and higher speed limits as visibility may be reduced. • Increase your visibility by wearing light-colored clothing, reflective material, and carrying a flashlight during nighttime or dawn/dusk hours.
Bicyclists
• Ride in the same direction of traffic. Bicyclists must adhere to the same rules and regulations as any slow-moving vehicle. • Employ hand signals and use bike lanes, when accessible. • Wear a helmet and ensure your bike is equipped with lights when riding at night.
Additional specialized enforcement operations will be conducted during the year focusing on areas with higher bicyclist and pedestrian traffic and crashes, and officers will also conduct public awareness campaigns in communities throughout the state.
This grant also funds bicycle safety training and educational presentations to promote safe and courteous traffic safety behaviors by drivers and bicyclists, as well as safety publications, bicycle helmets, reflective gear, and other vital safety equipment.
Funding for this program was provided by the California Office of Traffic Safety through a grant from the National Highway Traffic Safety Administration.
The National Endowment for Financial Education, or NEFE, has released the results of its in-depth opinion polling of Indigenous community members nationwide about their experiences with the financial services sector.
One-third of respondents say they have experienced bias, discrimination or exclusion from financial services institutions and individuals, which is double that of the general U.S. adult population.
This new data continues NEFE’s research into the disparate issues marginalized communities encounter.
“Through this polling, we are gaining a better understanding of the bias and exclusion that marginalized communities experience, and these data can be the key to helping researchers, educators and policymakers focus on improvements in access to equitable and effective learning interventions,” says Billy Hensley, Ph.D., president and CEO of NEFE. “Objective attention to these data will unequivocally provide decision makers with evidence to move toward meaningful change.”
NEFE, in conjunction with SurveyUSA, polled U.S. adults who are members of a native community. The sample was a cross-section of native respondents, including American Indian (73%), Indigenous American (21%), Native Hawaiian (11%), First Nations/Inuit (6%) and Alaska Native (5%).
Key outcomes of the polling were:
• One-third of respondents say they experienced bias, discrimination or exclusion by or from institutions and individuals within the financial services sector while seeking services related to banking, saving, lending, credit, insurance, taxes, financial planning, financial counseling and/or housing. Additionally, 15% say they are unsure if they experienced bias, discrimination or exclusion.
• When asked about owning a bank account, 17% of respondents say they are “unbanked,” defined as neither they nor any members of their household own a bank account. This is more than four times higher than the FDIC’s estimate of unbanked households nationwide. • Over the past year, 30% of respondents say they cashed a check somewhere other than a bank or a credit union.
• Ten percent say they took out a payday or payday advance loan sometime within the past year. When asked about using online payment services (PayPal, Venmo, etc.), 68% of respondents overall say they use these services, including 62% of unbanked respondents.
A breakdown of key data from the polls include:
• Of those who say they have experienced bias, discrimination or exclusion, 30% say they believed it was due to their race/ethnicity, while 27% feel their age was the cause.
• In addition, 27% of those who experienced bias, discrimination or exclusion strongly disagree that their financial situation helps them feel optimistic about their future.
• Over half (54%) say they can succeed financially if they put their mind to it.
• A majority of respondents who identify as Black (58%) say they have experienced bias, discrimination or exclusion in seeking financial services, compared to 48% of those identifying as Hispanic/Latino. In addition, 45% of those who identify as LGBTQ+ say they experienced bias, discrimination or exclusion.
• A quarter of respondents with household incomes < $30,000 say they are unbanked as do 21% of respondents who say they are currently unemployed.
• More respondents under 50 years old say they used a non-bank service to cash a check within the past year, compared to those over 50 years old (36% vs. 21%).
• Online payment services are preferred by those under 50 years old (81% vs. 49%).
“Collectively, the field of financial education must understand and heed the systemic, technological and personal barriers that exist to people proactively addressing their financial well-being. Through continued understanding of access challenges, particularly among Native communities, we can eliminate barriers and strive for more equitable solutions,” adds Hensley.
For more on this survey, visit the Consumer Poll section of the NEFE website.
The James Webb Space Telescope’s deep field image shows a universe full of sparkling galaxies. NASA/STScI
Astronomers have known for decades that the universe is expanding. When they use telescopes to observe faraway galaxies, they see that these galaxies are moving away from Earth.
To astronomers, the wavelength of light a galaxy emits is longer the faster the galaxy is moving away from us. The farther away the galaxy is, the more its light has shifted toward the longer wavelengths on the red side of the spectrum – so the higher the “redshift.”
Because the speed of light is finite, fast, but not infinitely fast, seeing something far away means we’re looking at the thing how it looked in the past. With distant, high-redshift galaxies, we’re seeing the galaxy when the universe was in a younger state. So “high redshift” corresponds to the early times in the universe, and “low redshift” corresponds to the late times in the universe.
But as astronomers have studied these distances, they’ve learned that the universe is not just expanding – its rate of expansion is accelerating. And that expansion rate is even faster than the leading theory predicts it should be, leaving cosmologists like me puzzled and looking for new explanations.
Dark energy and a cosmological constant
Scientists call the source of this acceleration dark energy. We’re not quite sure what drives dark energy or how it works, but we think its behavior could be explained by a cosmological constant, which is a property of spacetime that contributes to the expansion of the universe.
Albert Einstein originally came up with this constant – he marked it with a lambda in his theory of general relativity. With a cosmological constant, as the universe expands, the energy density of the cosmological constant stays the same.
Imagine a box full of particles. If the volume of the box increases, the density of particles would decrease as they spread out to take up all the space in the box. Now imagine the same box, but as the volume increases, the density of the particles stays the same.
It doesn’t seem intuitive, right? That the energy density of the cosmological constant does not decrease as the universe expands is, of course, very weird, but this property helps explain the accelerating universe.
A standard model of cosmology
Right now, the leading theory, or standard model, of cosmology is called “Lambda CDM.” Lambda denotes the cosmological constant describing dark energy, and CDM stands for cold dark matter. This model describes both the acceleration of the universe in its late stages as well as the expansion rate in its early days.
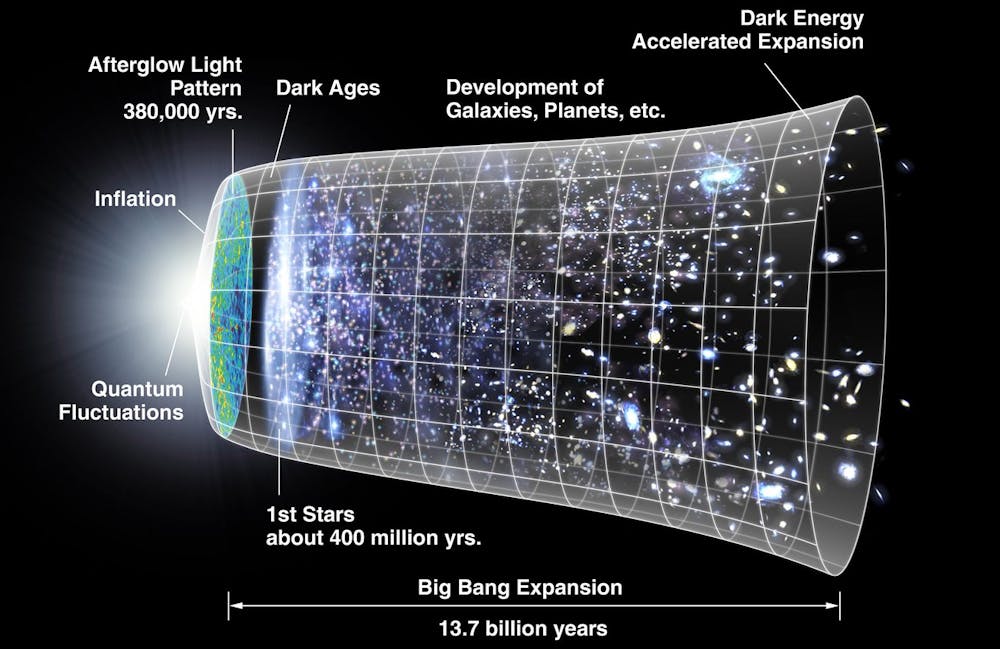
Specifically, the Lambda CDM explains observations of the cosmic microwave background, which is the afterglow of microwave radiation from when the universe was in a “hot, dense state” about 300,000 years after the Big Bang. Observations using the Planck satellite, which measures the cosmic microwave background, led scientists to create the Lambda CDM model.
Fitting the Lambda CDM model to the cosmic microwave background allows physicists to predict the value of the Hubble constant, which isn’t actually a constant but a measurement describing the universe’s current expansion rate.
But the Lambda CDM model isn’t perfect. The expansion rate scientists have calculated by measuring distances to galaxies, and the expansion rate as described in Lambda CDM using observations of the cosmic microwave background, don’t line up. Astrophysicists call that disagreement the Hubble tension.
The universe is expanding faster than predicted by popular models in cosmology.NASA
The Hubble tension
Over the past few years, I’ve been researching ways to explain this Hubble tension. The tension may be indicating that the Lambda CDM model is incomplete and physicists should modify their model, or it could indicate that it’s time for researchers to come up with new ideas about how the universe works. And new ideas are always the most exciting things for a physicist.
One way to explain the Hubble tension is to modify the Lambda CDM model by changing the expansion rate at low redshift, at late times in the universe. Modifying the model like this can help physicists predict what sort of physical phenomena might be causing the Hubble tension.
For instance, maybe dark energy is not a cosmological constant but instead the result of gravity working in new ways. If this is the case, dark energy would evolve as the universe expands – and the cosmic microwave background, which shows what the universe looked like only a few years after its creation, would have a different prediction for the Hubble constant.
But, my team’s latest research has found that physicists can’t explain the Hubble tension just by changing the expansion rate in the late universe – this whole class of solutions falls short.
Developing new models
To study what types of solutions could explain the Hubble tension, we developed statistical tools that enabled us to test the viability of the entire class of models that change the expansion rate in the late universe. These statistical tools are very flexible, and we used them to match or mimic different models that could potentially fit observations of the universe’s expansion rate and might offer a solution to the Hubble tension.
The models we tested include evolving dark energy models, where dark energy acts differently at different times in the universe. We also tested interacting dark energy-dark matter models, where dark energy interacts with dark matter, and modified gravity models, where gravity acts differently at different times in the universe.
But none of these could fully explain the Hubble tension. These results suggest that physicists should study the early universe to understand the source of the tension.
Dennis Fordham. Courtesy photo. Under present California trust law, trustees are the only fiduciaries (i.e., legally appointed representatives) with the duty, authority and power to administer a trust’s assets, liabilities and financial and legal affairs.
The trustee’s primary duty is to carry out the terms of the trust for the benefit of the beneficiaries.
Effective Jan. 1, 2024, however, the Uniform Directed Trust Act (“UDTA”) becomes law. The UDTA adds new sections 16600 to 16632 to the Probate Code to allow Directed Trusts to exist in California.
The UDTA allows for an additional type of fiduciary, called a Trust Director, to participate in trust administration.
The directed trust was created in the early 1900’s because wealthy families wanted to make trust investment decisions, instead of the trustee, that the trustee would perform. Under the UDTA, a trustee becomes a directed trustee.
A directed trustee must carry-out the trust director’s decisions within the scope of the trust director’s authority. That is, “[i]n a directed trust, the terms of the trust grant a person other than a trustee a power over some aspect of the trust’s administration.”
The trust director is essentially a trustee in all but name: “A trust director has the same fiduciary duty and liability in the exercise or nonexercised of the power, if the power is held individually, as a sole trustee in a like position and under similar circumstances … .”
The one difference is that the trust director is authorized to direct a trustee to take certain actions.
In fact, the UDTA allows a trust director to have a, ” [p]ower of direction [that] includes a power over the investment, management, or distribution of trust property or other matters of trust administration.”
Thus nothing in the UDTA prevents a trust director from controlling all of the trust administration and making the directed trustee a mere agent of the trust director.
The essence of the UDTA is that it allows for trust directors and directed trustees to have compartmentalized duties, for them not to become liable for what the other is doing, and for the trust director to direct the directed trustee.
Under the UDTA, the directed trustee and the trust director do not have to monitor each other’s performance of their duties, do not have to advise each other and do not have to warn the trust beneficiaries or the settlor who established the trust (if still alive) as to any concerns each may have regarding the decisions that the other is making.
A possible use of UDTA in California might be to appoint a trust director in a special needs trust with authority over all discretionary distributions for the special needs beneficiary.
The directed trustee’s risk of being held liable for complying with an instruction from a trust director is greatly reduced: “A directed trustee shall not comply with a trust director’s exercise or non-exercise of a power of direction … to the extent that, by complying, the trustee would engage in willful misconduct.”
The “willful misconduct threshold is a high standard to meet.
Interestingly, the UDTA allows the directed trust rules to apply to the duties and relationships between co-trustees. That is, co-trustees may be responsible for different areas of the trust administration, the same way as trust directors and directed trustees, and not have to monitor each other.
Again, a trust director is essentially the same as a trustee, so why not allow co-trustees a very similar relationship.
For example, one co-trustee could be responsible for investments and the other co-trustee be responsible for discretionary distributions to beneficiaries.
We do not know all the possible applications of the Directed Trust Act in California. We do know from the use of directed trusts in other states that the trust director’s role usually involves investment decisions, discretionary distribution decisions, and control over special assets that like investments require some special expertise (e.g., managing businesses, artwork, intellectual property, etc.).
The foregoing discussion is not legal advice. Consult a qualified estate planning attorney for guidance.
Dennis A. Fordham, Attorney, is a State Bar-Certified Specialist in estate planning, probate and trust law. His office is at 870 S. Main St., Lakeport, Calif. He can be reached at This email address is being protected from spambots. You need JavaScript enabled to view it. and 707-263-3235.
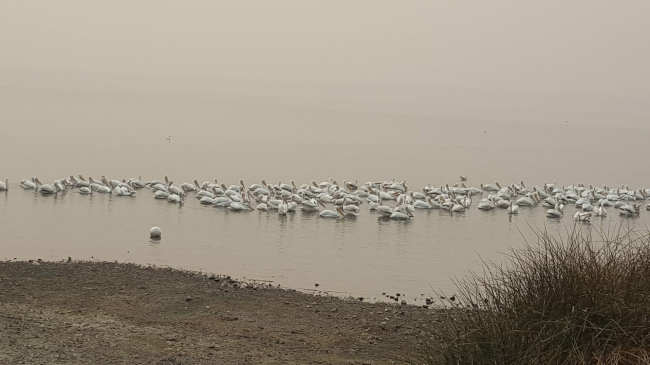
Pelicans enjoy the rich offerings of bait fish and safe refuge on Clear Lake. Photo: A. De Palma-Dow. Dear Readers,
In today’s column, I won't be answering a question, but I will be describing why I am grateful for Clear Lake and why Clear Lake is so special. I am grateful for this column and the readers – you! – because without your questions, comments, inquiries, and readership I wouldn’t be able to learn about, teach, and explore this wonderful lake on digital paper every two weeks to a month.
Part of this column will contain excerpts from a speech I recently gave as the guest speaker at the Lake County Land Trust 30th Celebration Dinner on Oct. 28 at Boatique Winery in Kelseyville. I was asked to talk about why “The Lady of the Lake Loves Clear Lake” and for many of those things I love I am also grateful for, and so today's column and that speech have some overlapping content.
If you don’t know much about the Lake County Land Trust, I recommend you visit their website and learn about the many properties they have acquired that are essential to the protection of land and water in Lake County for future generations of people, plants, and animals to enjoy.
Also, if you are looking for a local, nonprofit organization to donate to this holiday season, the Lake County Land Trust will use your donation in high-impact ways such as acquisition, restoration, management, and educational stewardship of lands around Clear Lake and within Lake County.
Bass fishermen travel from all over the Country to sample the rich, warm waters of Clear Lake. The unique nature of Clear Lake has helped to keep her in the top ten bass fishing lakes every year for several decades. Photo: A. De Palma-Dow. Why Clear Lake is unique and special
Clear Lake is very special, especially to a limnologist. Technically, I am a limnologist by degree and by trade, meaning I study and work with inland freshwaters, like lakes, streams, wetlands, and ponds. Between all my academic, professional, and personnel experiences, I have probably been to over 1000 lakes in my life (one summer when I worked for the University of Notre Dame Center for Aquatic Conservation, our team visited 500 lakes in Ohio, Indian, and Illinois alone!), and I can still confidently say that Clear Lake is my favorite.
Clear is firstly unique and special because of her shape, containing three individual basins that express their own wind patterns and currents. This shape means that you can be in one part of the lake and have calm, quiet waters, and once you travel into another part, you will have turbulent waves or whitecaps. She has multiple personalities, mostly driven by her shape and form.
I talked about the formation and shape of Clear Lake in a previous column “Clear Lake Creation Story.” This column also describes how the lake has shifted watersheds by changing flows from south to north back to south again.
Clear Lake is really not like any other lake in the world, and while there are many reasons why she is special, from the perspective of a limnologist, I will present a few of the things that make her very special to me.
Clear lake is old and little studied compared to younger lakes
Historically, the field of limnology has been studied on large, deep lakes, usually in higher latitudes, think European countries, Canada, Wisconsin, Great Lakes, New York areas; these lakes also ice over during the cold, winter months.
To see an example of such lakes, visit website for the Canadian Experimental Lakes Area (https://www.iisd.org/ela/about/, now managed by The International Institute for Sustainable Development) which was established as The Freshwater Institute in 1966 to study important lake issues like acid rain and agricultural impacts to lakes in North America.
The term limnology was coined in 1868 by a swiss doctor studying Lake Geneva and in 1908, limnology was born in North America is the University of Wisconsin, Madison.
These type of lakes (i.e. northern latitude, cold, and deep) are essential to whole – lake manipulation and comparison studies (like those that determined that phosphorus is the nutrient that drives algal growth, and sometimes specific ratios or combinations of nitrogen and phosphorus are needed to drive algal growth).
Throughout the 20th century, these studied lakes provided valuable information and data that would lead to the basic foundational knowledge of limnology and lake management, but these lakes represent only a subset of lakes that exist in the world.
For example these lakes are located in cool-cold remote forest, boreal regions, they stratify during winter and summer and mix in spring and fall, and they ice over during winter. These lakes are also mostly oligotrophic or mesotrophic, or classified as low or medium in productivity, with relatively low baseline concentrations of nutrients and algae growth.
Information derived from these lakes might not apply or not apply in the same way for mediterranean lakes, tropical lakes, polymictic lakes, (more than two mixing events), shallow, or naturally eutrophic lakes. Clear Lake checks all the boxes in this list except for being tropical.
Additionally,many of these lakes are remnants of the last glacial retreat, which was fairly recent, in geological terms. In fact, the great lakes are only about 20,000 years old, and were formed by retreating continental glacial ice sheets.
Lakes in the midwest are slightly older, since they were at the edge of glacial retreat, and lakes in Canada are slightly younger as they were at the end of the retreat.
To put this in perspective, the area of Clear Lake has had a presence of water, as a lake, pond, wetland, and interconnecting streams, for about 2.5 million years. The Clear Lake we see today, has been in its general shape and form for about 500,000 years.
Clear Lake is older than most other North American lakes, and is probably the oldest freshwater lake. Mono Lake is a prehistoric lake, but is a saline soda lake.
While Clear Lake is old for North America, she is a toddler compared to some of the oldest lakes in the world. For example, Lake Zaysan in Kazakhstan is about 60 million years old and Lake Baikal in Siberia is about 25 million years old.
Age is just a number, right?
When it comes to age, the amount of time a lake has been around is very important. All the in-lake processes that contribute to the form and function of the lake, can be influenced by a lake’s age. For Clear Lake, this is especially true because she has a large, shallow basin.
The upper arm of Clear Lake is probably on a slow trajectory to becoming a very large marsh, and for lakes, this process can take a long, long time. First the basin has to become shallow, a physical process over time that requires the accumulation of sediments. Then the basin has to fill in with aquatic and wetland plants.
If you think about it, the upper arm collects sediments from the Middle-Scotts Creek subwatershed through Rodman Slough. There is even an island that formed outside of Rodman slough from the collection of sediment leaving the slough and during the drought, the land bridge at the mouth of Rodman Slough was populated by wetland plants and a refuge for waterfowl, otters, and deer.
During the summer months, the amount of aquatic and shoreline vegetation is significant, and in some areas poses a nuisance to boaters and water users that the county of Lake maintains a permitted aquatic plant management program to chemically treat and control submerged aquatic plants that can clog boat motors and propellers.
Through the shoreline development process over the last 100 years, about 50 percent of Clear Lake’s original wetlands were removed. Within the upper arm, before development, the shoreline probably comprised 50-200 feet wide stretches of tule, spikerush, smartweed, water lilies, and other emergent and floating leaf aquatic plant species. This plant community would creep inward and outward to coincide with the lake’s fluctuating water levels.
Aerial satellite view of Clear Lake captured in 2012 as part of the County of Lake’s Bluewater Satellite project to identify sources of sediments and nutrients into the lake. More information can be found online: https://www.lakecountyca.gov/1504/Clear-Lake-Water-Quality. The large areas of shoreline vegetation were essential in presenting large sediment inputs from contributing large nutrient banks to the rest of the lake. The vegetation buffer would have trapped the sediment and nutrient inputs, and used them to build upon more vegetation, both as infrastructure and as a nutrient source.
Without the large vegetative shoreline around the lake, inputs are free to flow and move throughout the upper arm, getting picked up by currents and mobilizing throughout the rest of the lake. Check out this Science Friday post on the county of Lake Water Resources Department’s Facebook page describing the currents throughout Clear Lake.
Now, without the vegetative shoreline around the lake, large inputs, from storms mostly, can contribute nutrient-rich sediment into the lake, which can serve as a ready-made food source for cyanobacteria and algae.
In fact there have been so many inputs into the lake, that the lake has built up a large nutrient sediment bank at the bottom of the lake. This means that additional inputs, while important, are not a large contributor as the nutrients already stored in the sediment bank. This is also unique to Clear Lake.
Most of the lakes I mentioned earlier in the column, that formed the basis of limnological study, would respond quickly to manipulated inputs from external sources, meaning that if an external source of nutrients or sediments was completely removed, the lake would rebound and algae growth would lessen. Remember, these are experimental lakes, so researchers did manipulate lakes by adding large doses of nutrients just to see what would happen or not happen.
Clear Lake is different. Even when there are large, but sporadic, inputs of soils and sediments, like from a wildfire, they don’t have much impact on the internal lake nutrients, especially phosphorus concentrations.
Last year, working with partner limnologists from Michigan State University and Dartmouth College, we conducted a research study on the impacts of wildfire and climate change in the Clear Lake basin. We published the paper in the online, public access journal Ecosphere (Vol 13, issue 12).
We found that climate change impacts, including low winter rain, warmer winter temperatures are associated with increased phosphorus in the water column (where it can feed cyanobacteria and algae) and wildfires are not.
When we looked at the phosphorus concentrations in the water column of all three arms, three years before and three years after major wildfires in the Clear Lake basin (1982, 1996, 2018), we did not see any differences.
Meaning that phosphorus concentrations didn’t change, didn’t increase or decrease, before or after large wildfires, during the time period that we have in-lake phosphorus water quality data (1968-2020). Data used for this study can be found from the Department of Water Resources Data water library.
This is a unique finding for lakes, as most other lakes studied for wildfire impacts are highly impacted by fires occurring in their basin, but Clear Lake is not. She has probably evolved with wildfires over time, and the highly eutrophic nature of her water quality, already enriched with phosphorus, is unaffected by a wildfire here or there. And this is just one more thing that makes Clear Lake unique and special.
Clear Lake vs. Reservoirs
I receive many questions, both through my Lady of the Lake email, and my phone at my day job for County of Lake Water Resources, but the most common question I get is probably, “how and when is the lake going to be cleaned?”
This is a difficult question, in several ways. Let’s think about a useful follow up question, what does a “clean” lake look like? If you close your eyes and picture this in your mind, what does it look like to you?
If you described blue, clear, cold water, then you probably need to evaluate what your perception of a large, shallow, old, and naturally formed freshwater lake looks and acts like.
Most of the time, when people describe their ideal “cleaned up” lake, they are describing reservoirs. And, of course we can’t compare Clear Lake to reservoirs, which are at most 90 years old. In fact, according to the FEMA National Inventory of Dams, the average age of reservoirs (that are dammed) is only 61 years.
When you think about it, a 61 year old lake is a baby, infant lake. Clear Lake is surrounded by these baby, reservoir lakes, such as Barryessa, Folsom, Shasta, Mendocino and Sonoma, just to name a few.
These baby lakes are flowing systems really, that are almost completely drained each year and refilled with fresh and clean rain water. Reservoirs are drained from the bottom, which allow any built up sediments and nutrients in the water column to also flow out the dam intake and down river, sometimes powering hydroelectric facilities. Clear Lake, has a natural outflow, over the Grigsby Riffle at a narrow point in Cache Creek. This outflow point is at the top of the water column actually. Any water that flows down Cache Creek, leaving Clear Lake, is from the surface, like a pitcher of water filled to the top – the top will leave the pitcher through the spout if overfilled. The bottom water will remain in the pitcher unless enough water is added to overflow at the spout.
This means that, generally, any materials that flow into the lake from the rivers, creeks, or urban areas, can basically remain in the lake forever because they sink and settle to the bottom and the only point of water that is leaving the lake is from the surface of the lake to about 7 feet, or when the lake stops flowing down through Cache Creek and over the Grigsby Riffle.
This concept is really important when comparing Clear Lake to reservoirs and understanding why Clear Lake will never, ever look or act like a reservoir.
To make the analogy clear, reservoirs are brand new, shiny, right out of the box, like a slip n’ slide, with clean hose water moving over the plastic. Clear Lake is an above ground pool that has been left outside for 500,000 years. Clear Lake actually looks pretty good, considering this analogy. But no wonder she is green and full of life!
No other lake in the world is like Clear Lake. She is fascinating and complicated. Restoring her to her prior glory, whatever that might be, it’s still being determined, will take a long time, and a highly collaborative effort.
This complicated uniqueness of Clear Lake is what makes her so special, and why I love being able to work on this fascinating system. There will always be a need for further research on Clear Lake, because she is so unique and not like any other lakes out there. This is why I am grateful for Clear Lake, and thankful that I get to write about her in the Lake County News.
Sincerely,
Lady of the Lake
Angela De Palma-Dow is a limnologist (limnology = study of fresh inland waters) who lives and works in Lake County. Born in Northern California, she has a Master of Science from Michigan State University. She is a Certified Lake Manager from the North American Lake Management Society, or NALMS, and she is the current president/chair of the California chapter of the Society for Freshwater Science. She can be reached at This email address is being protected from spambots. You need JavaScript enabled to view it..
MIDDLETOWN, Calif. — The Middletown Area Merchants Association warmly invites the community to the 35th annual Christmas in Middletown event.
The festivities will be held on Saturday, Dec. 9, from 4 to 8 p.m.
Since 1988 the town Christmas festival has been growing and evolving. Starting as a vendor craft fair, it grew to include our storefront merchants, community service groups, food vendors, fundraising youth groups and more.
This year’s schedule of events includes the following:
4:30 to 6 p.m.: Santa will be at Middletown Mail and More for children and photo opportunities.
5:30 p.m.: Christmas tree lighting ceremony.
5:30 to 7 p.m.: Children’s activities at the library in the community room.
7:30 p.m.: Posada pinata breaking at the Middletown Art Center
This year the event will feature:
• Food court in central downtown • Vendors. • Passport to Fun Game with prizes for the lucky winners. • Car show at the town park. • Posada singing procession throughout the event sponsored by Middletown Art Center. • Street decorated with donated Christmas trees with decorations made by local school children that will be given to local families in need. • Maker’s Faire at Middletown Art Center. • Businesses will be open into the evening. • South Lake County Fire District’s Candy Can Run.
The Middletown Area Merchants Association sponsors this event.
“We are hoping for community and business support to decorate the town in a festive spirit. This is a great way to keep your dollars local and to explore all this sweet town has to offer,” the association said.
This annual event is always the second Saturday in December, rain or shine.
They always need volunteers to make this a successful event for all. Contact the association at This email address is being protected from spambots. You need JavaScript enabled to view it..
Artist’s concept of exoplanet LTT 1445ac. Courtesy image. The NASA/ESA Hubble Space Telescope has measured the size of the nearest Earth-sized exoplanet that passes across the face of a neighboring star.
This alignment, called a transit, opens the door to follow-on studies to see what kind of atmosphere, if any, the rocky world might have.
The diminutive planet, LTT 1445Ac, was first discovered by NASA’s Transiting Exoplanet Survey Satellite in 2022.
But the geometry of the planet’s orbital plane relative to its star as seen from Earth was uncertain because TESS does not have the required optical resolution.
This means the detection could have been a so-called grazing transit, where a planet only skims across a small portion of the parent star’s disk. This would yield an inaccurate lower limit of the planet’s diameter.
“There was a chance that this system has an unlucky geometry and if that’s the case, we wouldn’t measure the right size. But with Hubble’s capabilities we nailed its diameter,” said Emily Pass of the Harvard-Smithsonian Center for Astrophysics in Cambridge, Massachusetts.
Hubble observations show that the planet makes a normal transit fully across the star’s disk, yielding a true size of only 1.07 times Earth’s diameter. This means the planet is a rocky world, like Earth, with approximately the same surface gravity. But at a surface temperature of roughly 260 degrees Celsius, it is too hot for life as we know it.
The planet orbits the star LTT 1445A, which is part of a triple system of three red dwarf stars that is 22 light-years away in the constellation Eridanus.
The star has two other reported planets that are larger than LTT 1445Ac. A tight pair of two other dwarf stars, LTT 1445B and C, lies about 4.7 billion kilometers away from LTT 1445A, also resolved by Hubble.
The alignment of the three stars and the edge-on orbit of the BC pair suggests that everything in the system is coplanar, including the known planets.
“Transiting planets are exciting since we can characterize their atmospheres with spectroscopy, not only with Hubble but also with the James Webb Space Telescope. Our measurement is important because it tells us that this is likely a very nearby terrestrial planet. We are looking forward to follow-on observations that will allow us to better understand the diversity of planets around other stars,” said Pass.
"Hubble remains a key player in our characterisation of exoplanets", added Professor Laura Kreidberg of the Max Planck Institute for Astronomy in Heidelberg (who was not part of this study). "There are precious few terrestrial planets that are close enough for us to learn about their atmospheres — at just 22 light years away, LTT 1445Ac is right next door in galactic terms, so it’s one of the best planets in the sky to follow up and learn about its atmospheric properties."
The Hubble Space Telescope is a project of international cooperation between ESA and NASA.

 How to resolve AdBlock issue?